图表与面板库 (Figure Explorer)
全量索引各篇文献的高清主图,支持直观查看图表与 Panel 对应关系。
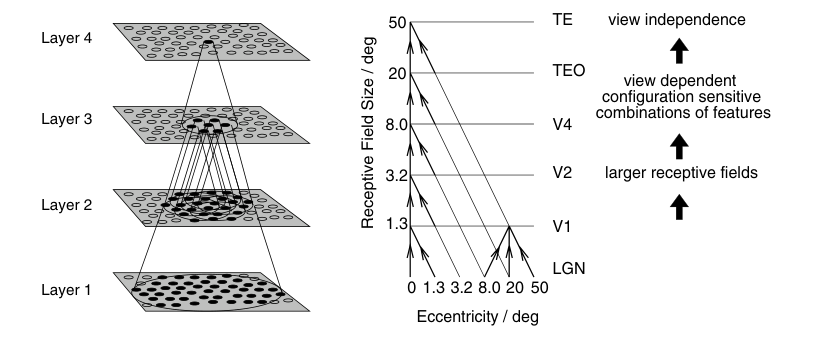
支持图注所述: Figure 1: (Left) Stylized image of the VisNet four-layer network. Convergence
through the network is designed to provide...
partially_verified
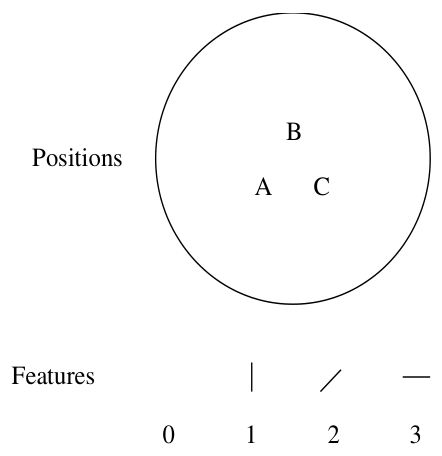
支持图注所述: Figure 2: Details of the 3-dimensional visual stimuli used in the rotation invari-
ance experiments of section 3. Each s...
verified
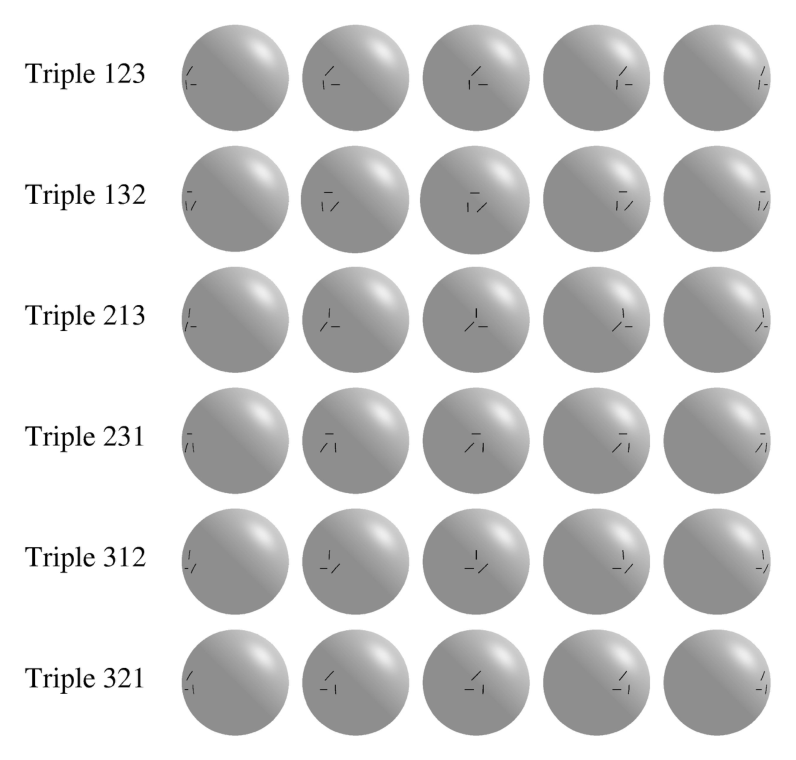
支持图注所述: Figure 3: Representations of the six visual stimuli with three surface features
(triples) presented to VisNet during the...
verified
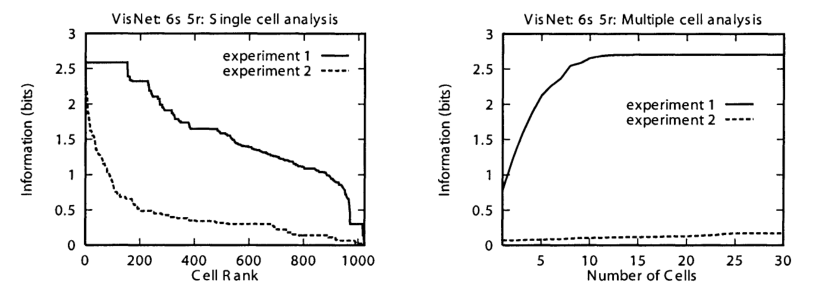
支持图注所述: Figure 4: Numerical results for experiments 1 and 2: (Left) Single cell infor-
mation measures. (Right) Multiple cell in...
partially_verified
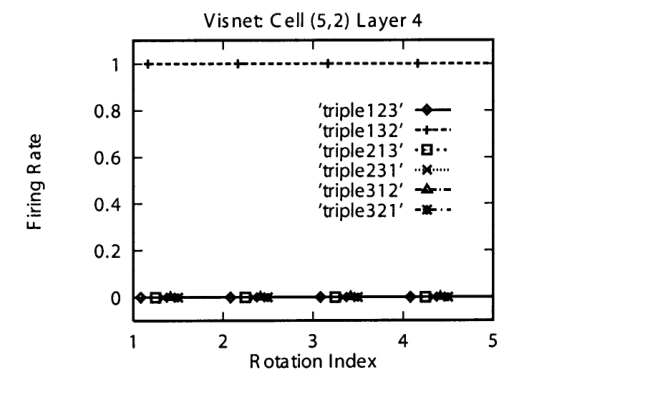
支持图注所述: Figure 5: Numerical results for experiment 1: Response profiles of a top-layer
neuron to the 6 triples in all 5 orientati...
partially_verified
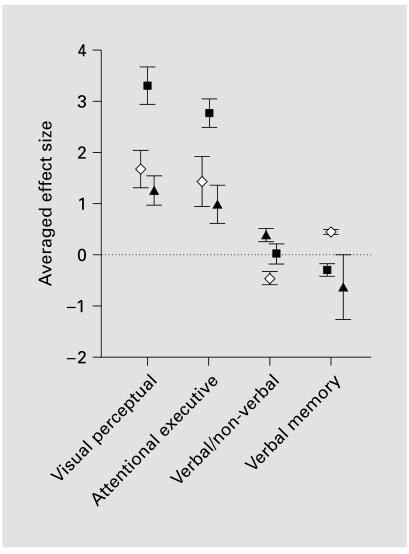
支持图注所述: Fig. 1. Results of comparisons between DLB
and controls, AD, and PD patients on fac-
tors. $ = DLB compared to controls;...
verified
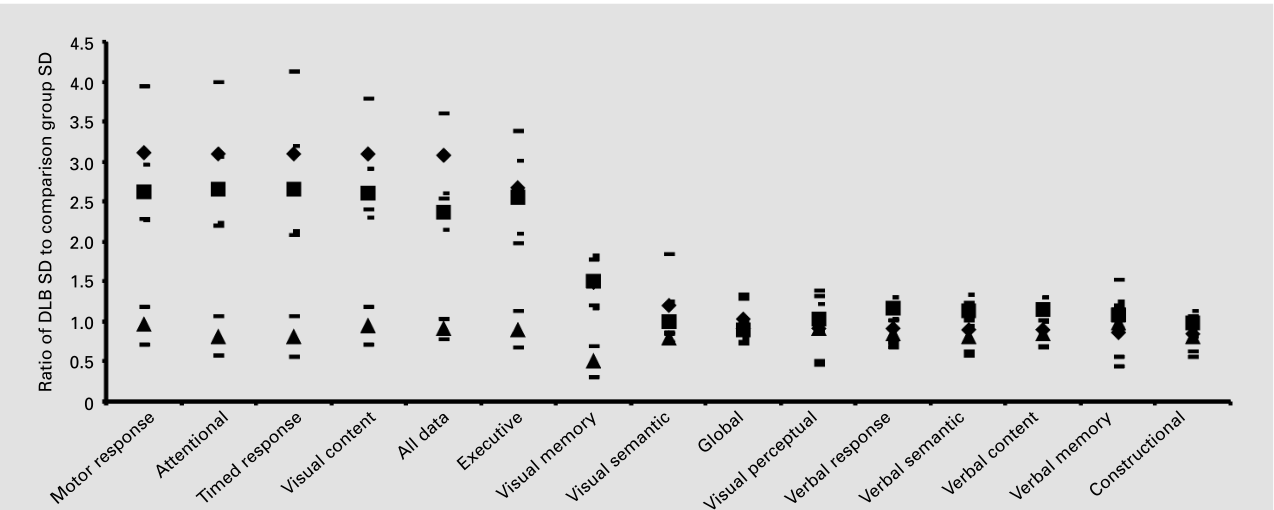
支持图注所述: Fig. 2. Ratio of standard deviations (SD) of DLB groups compared to controls and patients with AD and PD strati-
fied by...
verified
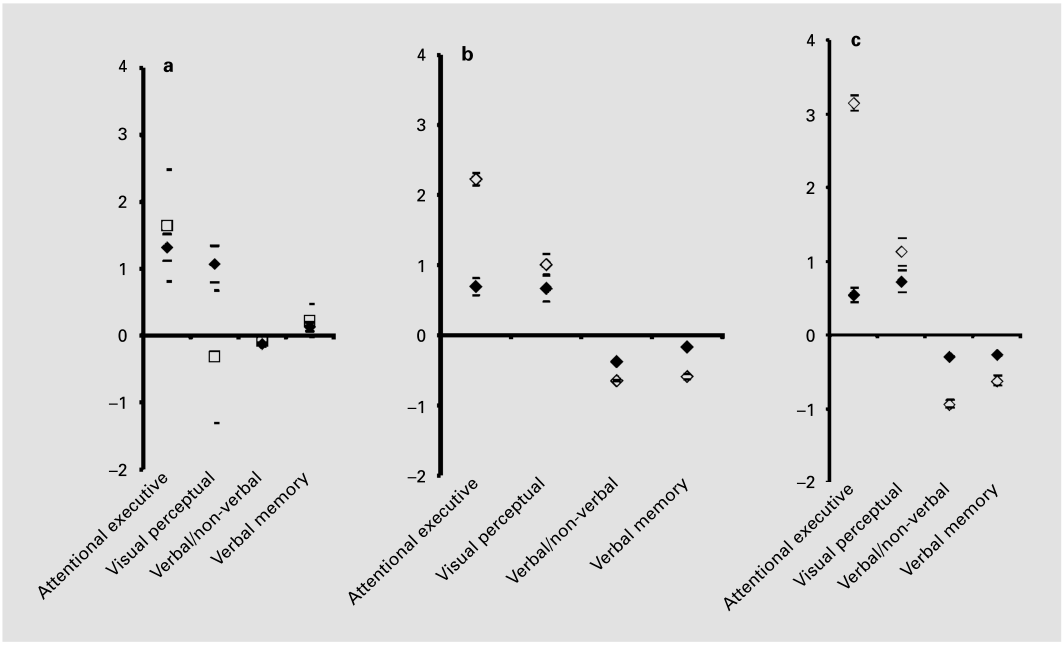
支持图注所述: Fig. 3. Results of secondary stratification by clinical versus pathological diagnosis, mild versus severe dementia, and
...
verified
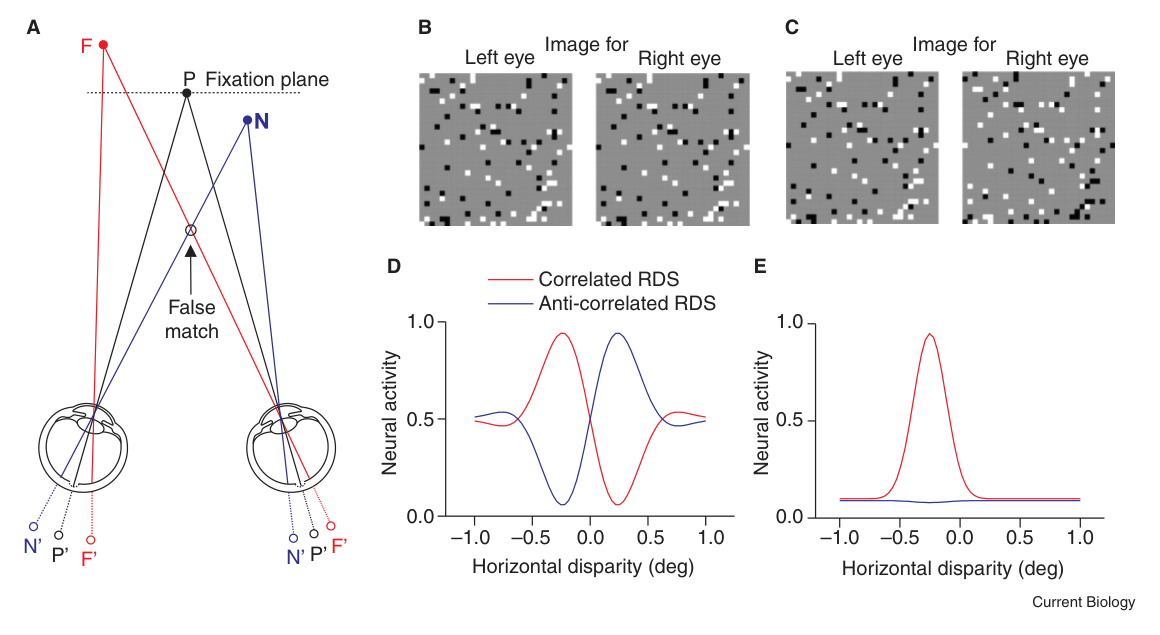
支持图注所述: Figure 1. Geometric relationships in binocular vision and disparity detectors.
(A) An observer fixates point P, the imag...
verified
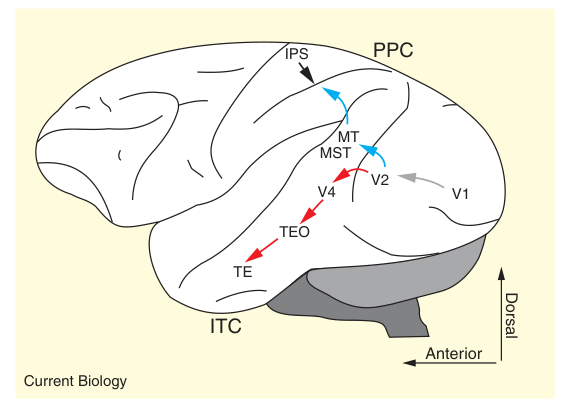
支持图注所述: Figure 2. Simplified scheme of the ventral (red) and dorsal
(blue) visual pathways in the monkey brain.
IPS, intra-parie...
verified
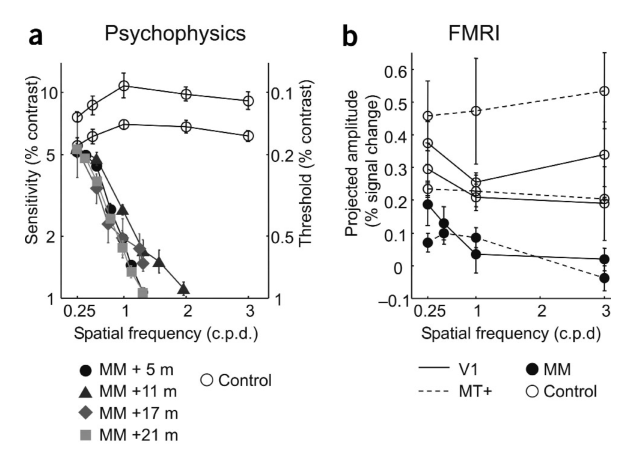
支持图注所述: Figure 1 (a) MM’s sensitivity as a function of spatial frequency measured
psychophysically using a method of adjustment ...
verified
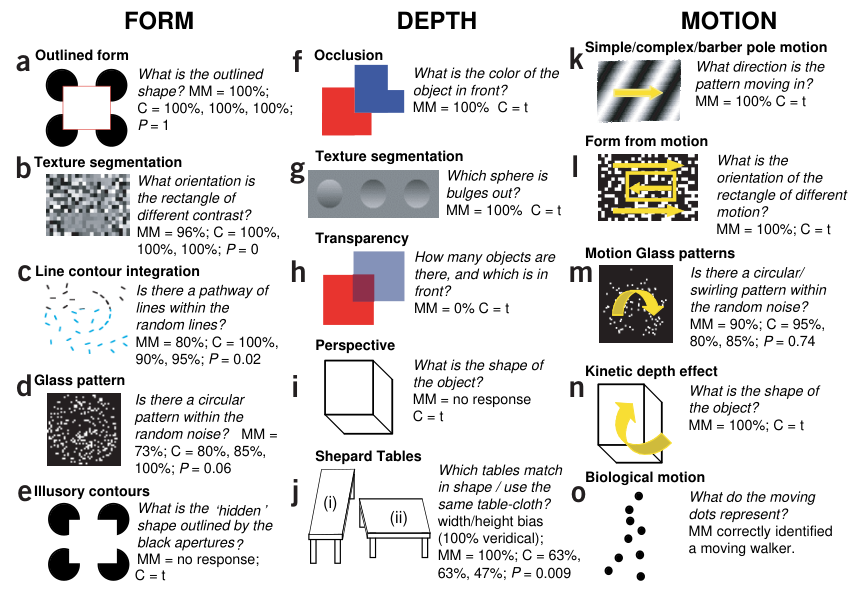
支持图注所述: Figure 2 Stimuli, tasks and performance for tests of
MM’s form, depth and motion processing. Stimuli
shown to controls (...
verified
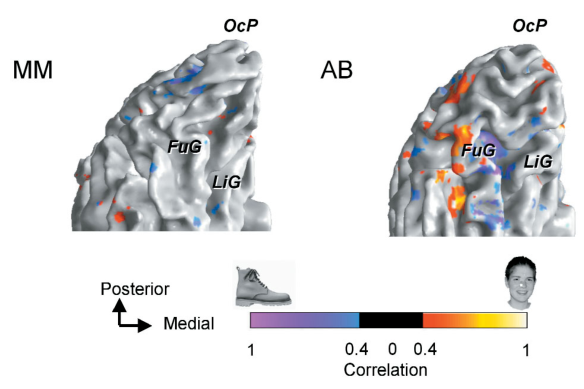
支持图注所述: Figure 3 Left hemisphere activation in response to faces versus objects,
regions responding at a coherence value above 0...
verified
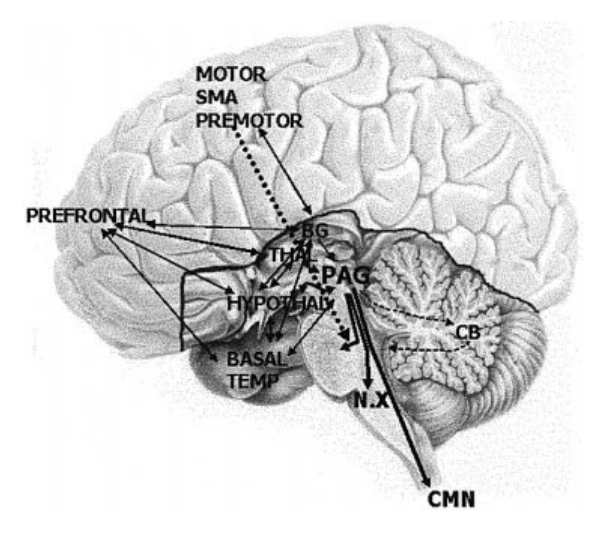
支持图注所述: Fig. 1 The laughter network: regions involved in the generation of
normal and pathological laughter. Note that in the me...
verified
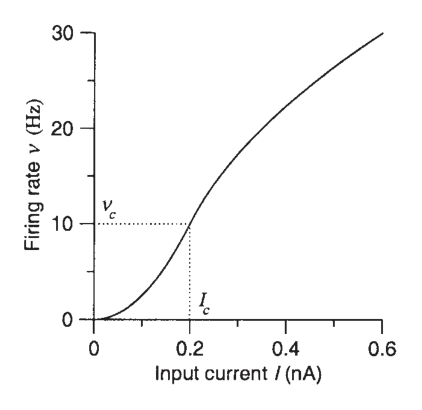
支持图注所述: Figure 1. The single neuron f–I curve φ(I). For input currents below the threshold
current Ic (noise-induced firing), th...
verified
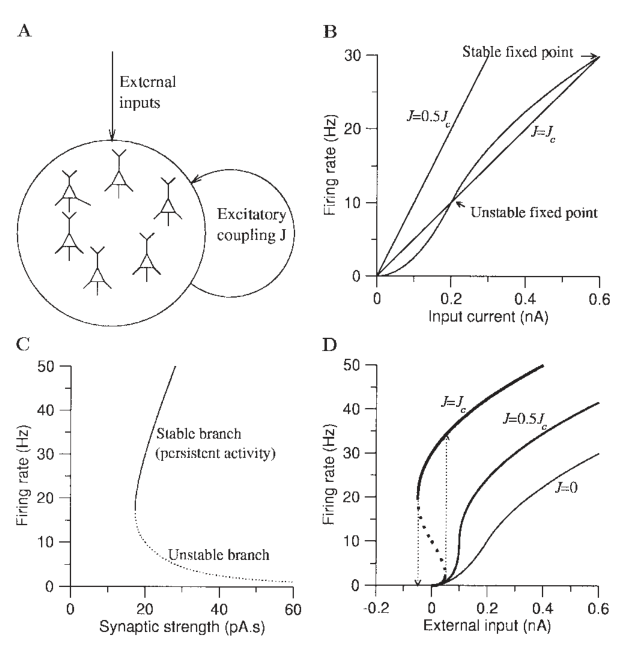
支持图注所述: Figure 2. The simplest bistable network is a purely excitatory network with uniform
coupling. (A) Network architecture. ...
verified
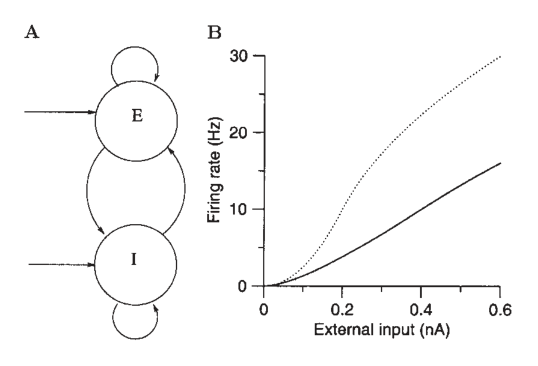
支持图注所述: Figure 3. Spontaneous activity in an excitatory–inhibitory network. (A) Architecture of
the excitatory–inhibitory networ...
verified
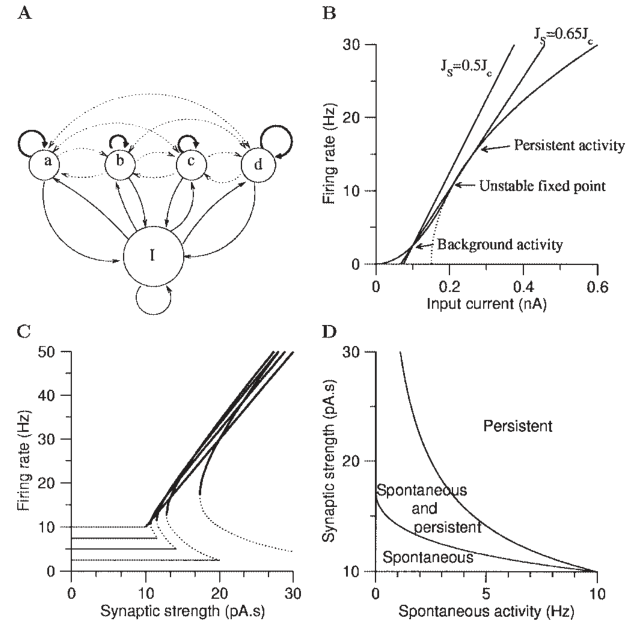
支持图注所述: Figure 4. Cortical network with selective sup-populations of excitatory cells. (A)
Functional architecture of a network ...
verified
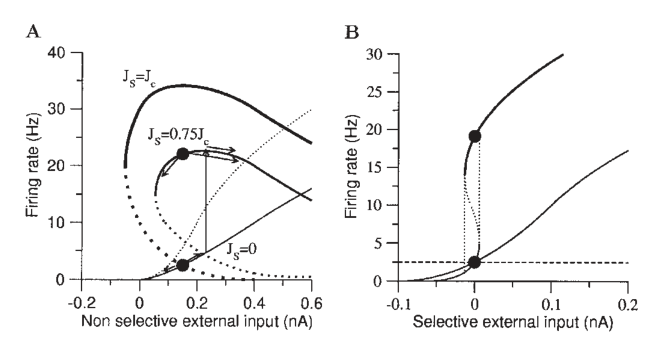
支持图注所述: Figure 5. Spontaneous and persistent activity as a function of external input. (A) Non-
selective external input: input ...
verified
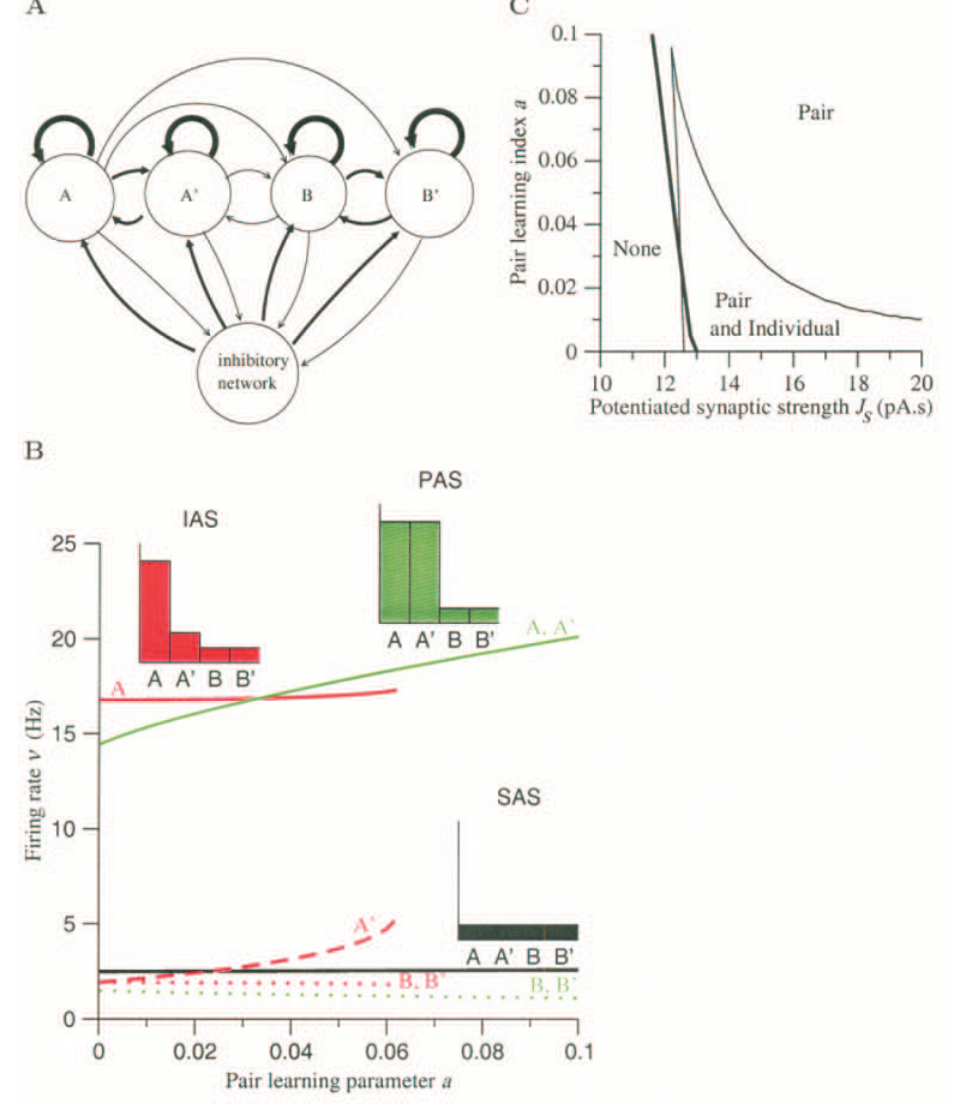
支持图注所述: Figure 6. The pair-associate protocol. (A) Architecture of a network after learning of pair associates. (B) Firing rates...
verified
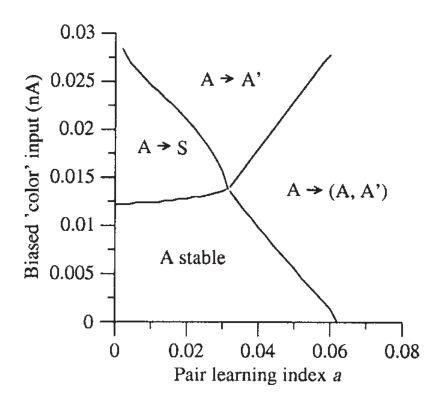
支持图注所述: Figure 7. Pair associate task with color switch. Effect of a weak biased input to the
class of the paired associate in t...
verified
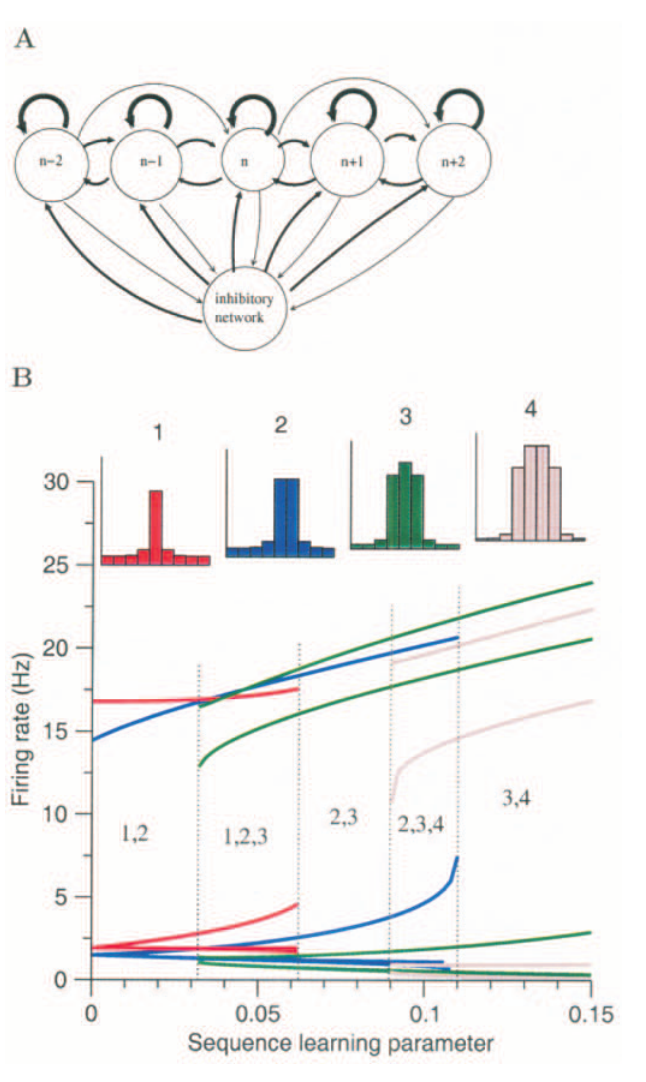
支持图注所述: Figure 8. Fixed sequence of cue stimuli. (A) Architecture of the network after
learning. (B) Persistent activity pattern...
verified
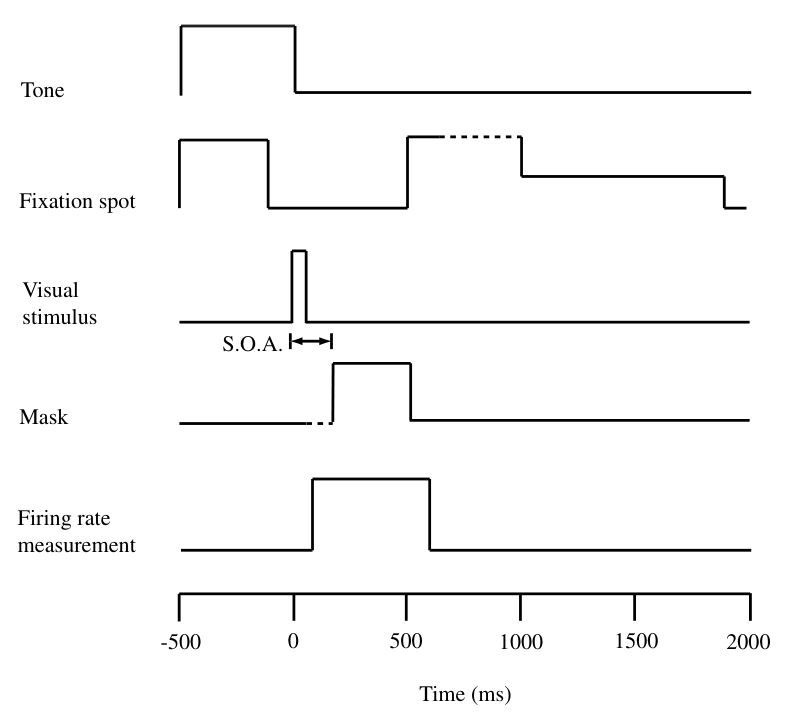
支持图注所述: Fig. 1. The timing used in the backward masking visual fixation blink task. The Stimulus Onset Asynchrony is the time bet...
verified
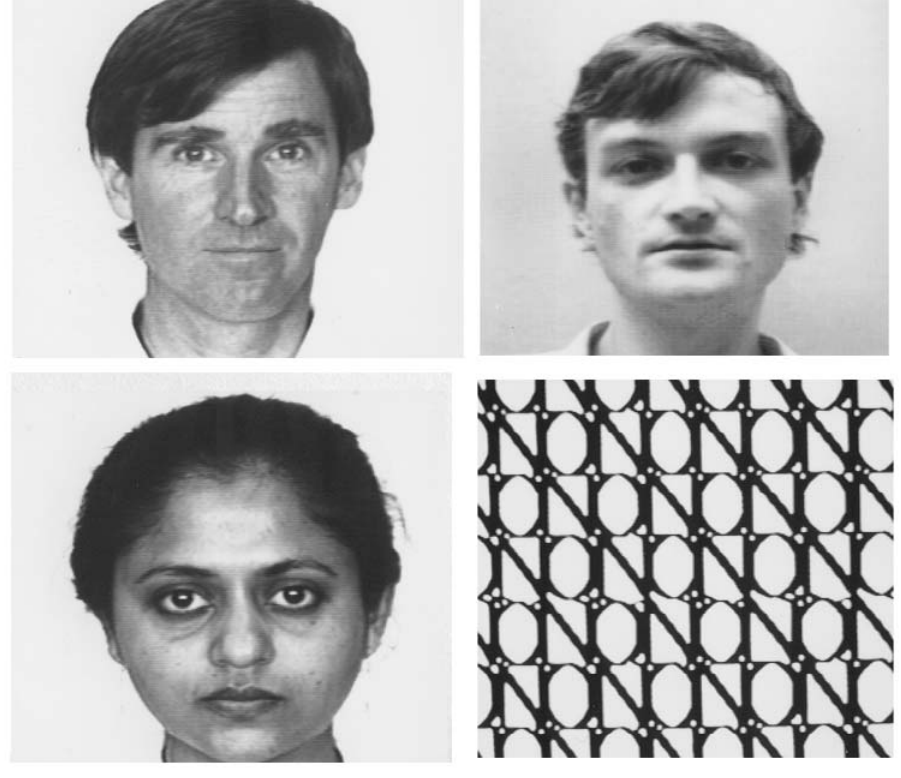
支持图注所述: Fig. 2. Examples of the test images used. The mask is also shown. (After Rolls et al., 1994.)...
verified
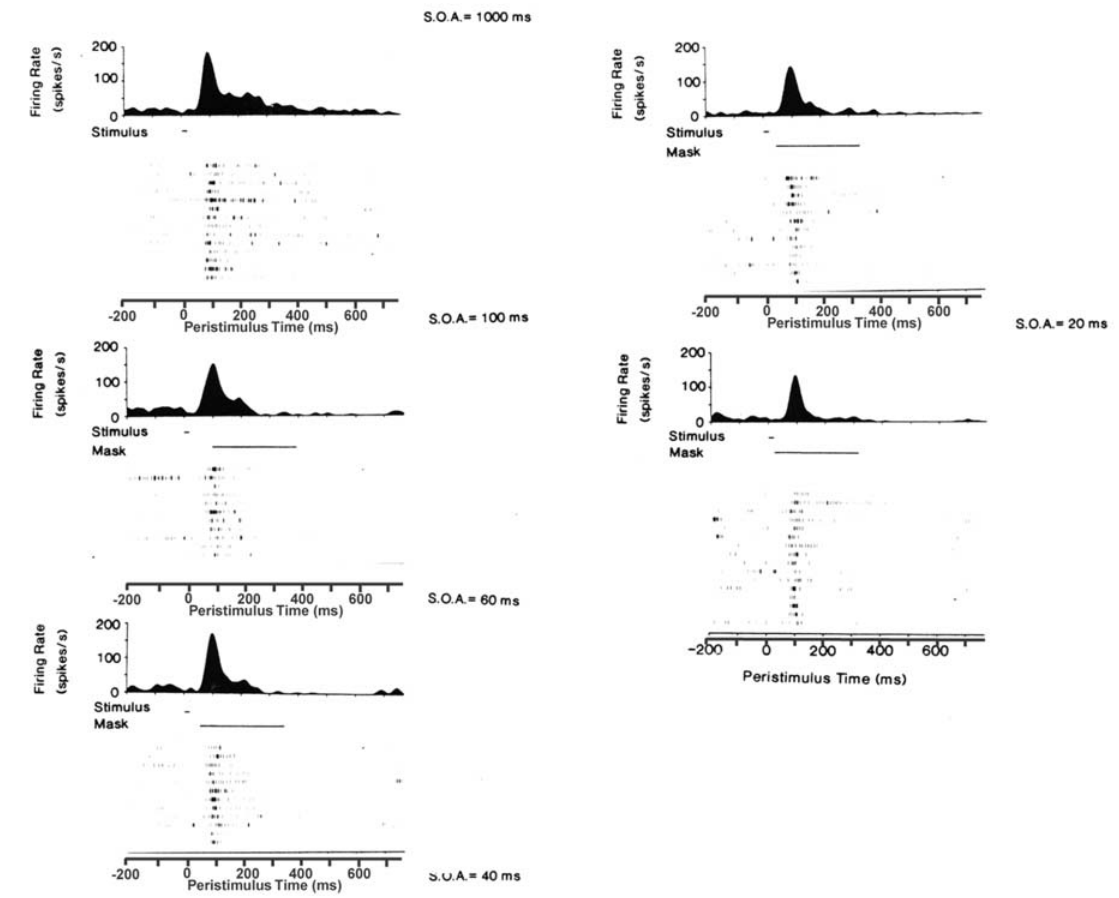
支持图注所述: Figure
3
shows
examples
of
the
effects
of
backward masking on the responses of a single
inferior temporal cortex neuron i...
partially_verified
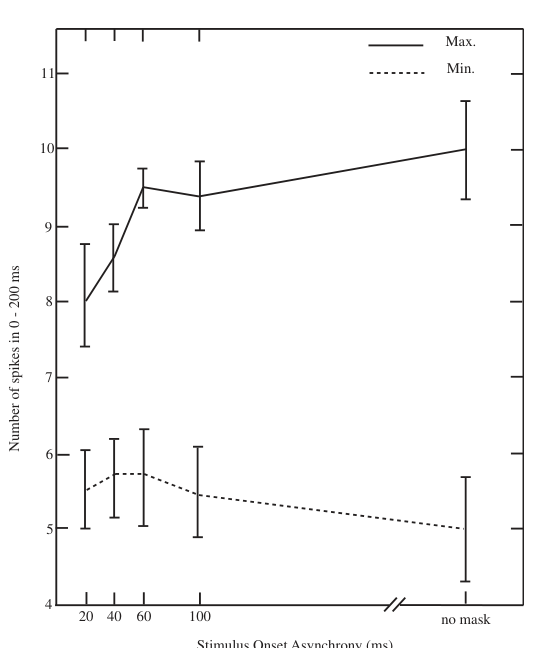
支持图注所述: Fig. 4. The mean (sem) across cells of the number of spikes
produced by the most effective stimulus (max) and the least
...
verified
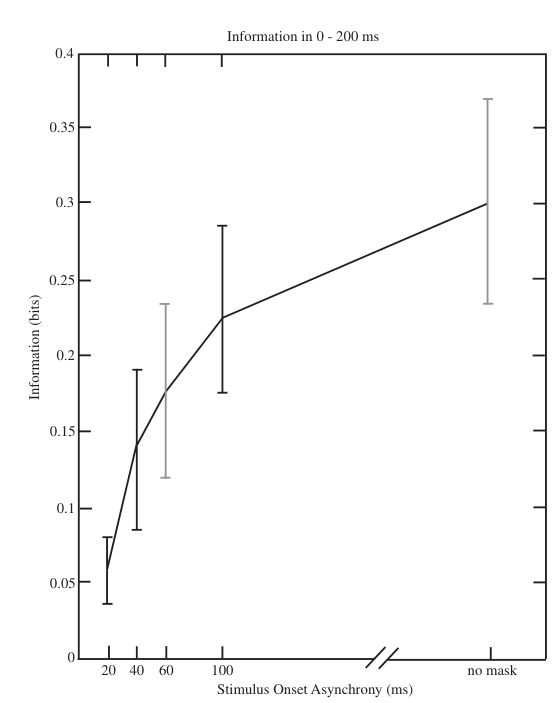
支持图注所述: Figure 5 shows the average across the cells of the
cumulated information available in a 200 ms period
from stimulus onse...
partially_verified
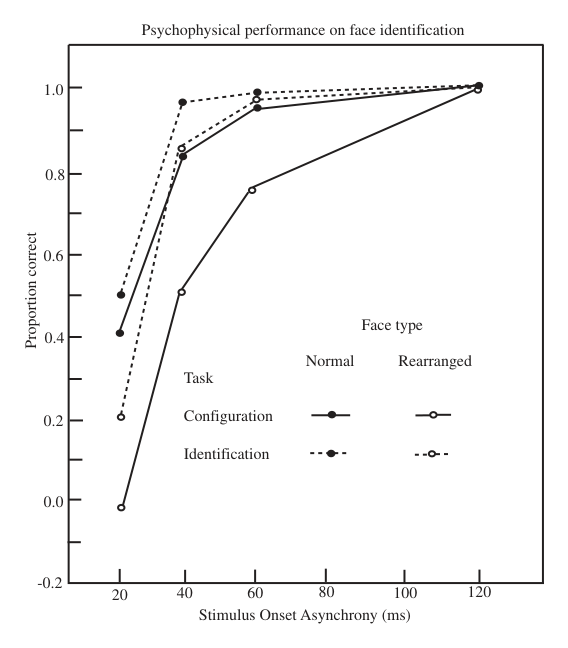
支持图注所述: Fig. 6. Psychophysical performance of humans with the same
stimuli as used in the neurophysiological experiments describ...
verified
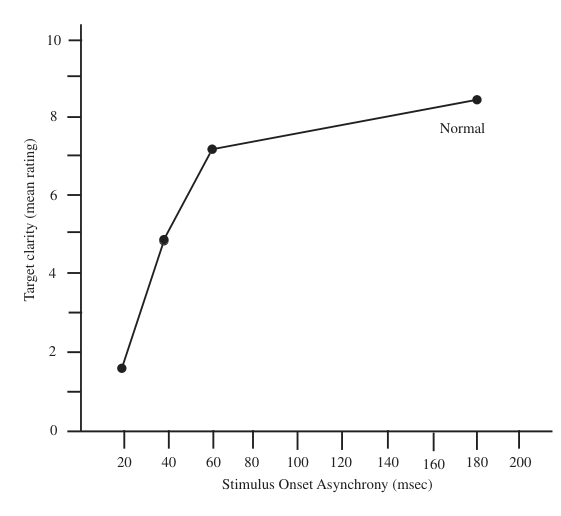
支持图注所述: Fig. 7. Rating of the subjective clarity of faces as a function of
stimulus onset asynchrony (S.O.A.). The mean of the m...
verified
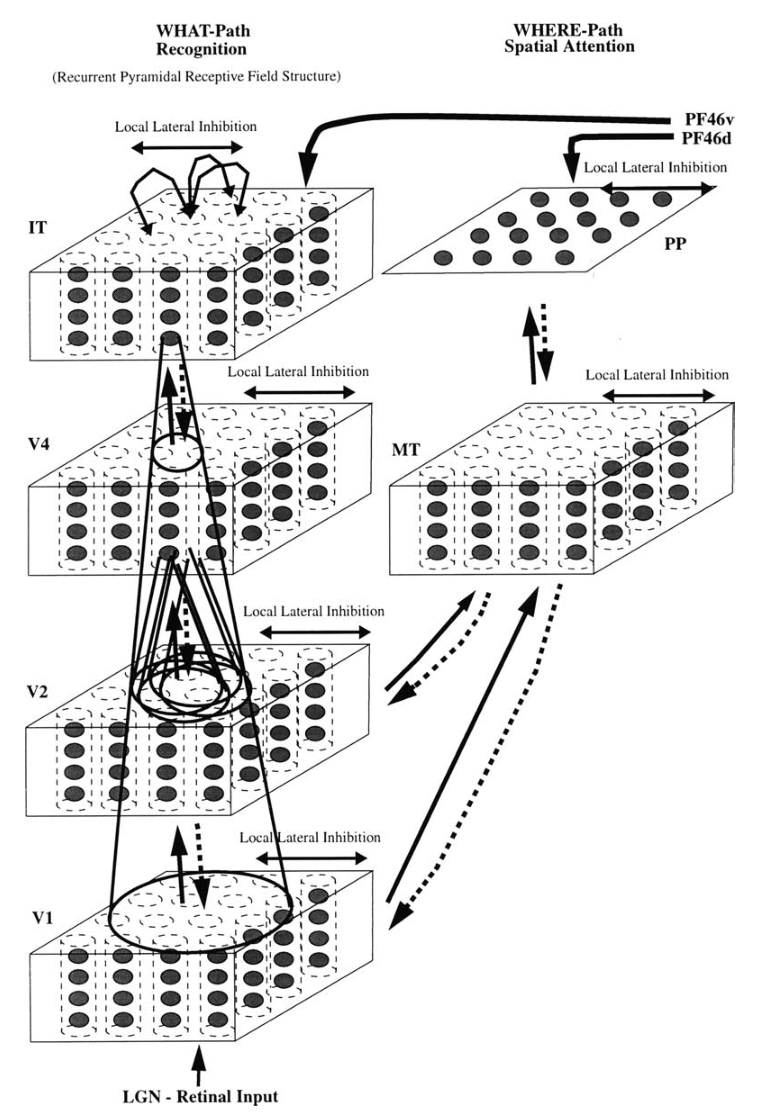
支持图注所述: Fig. 1. Cortical architecture for hierarchical and attention-based visual perception. The system is essentially composed...
verified
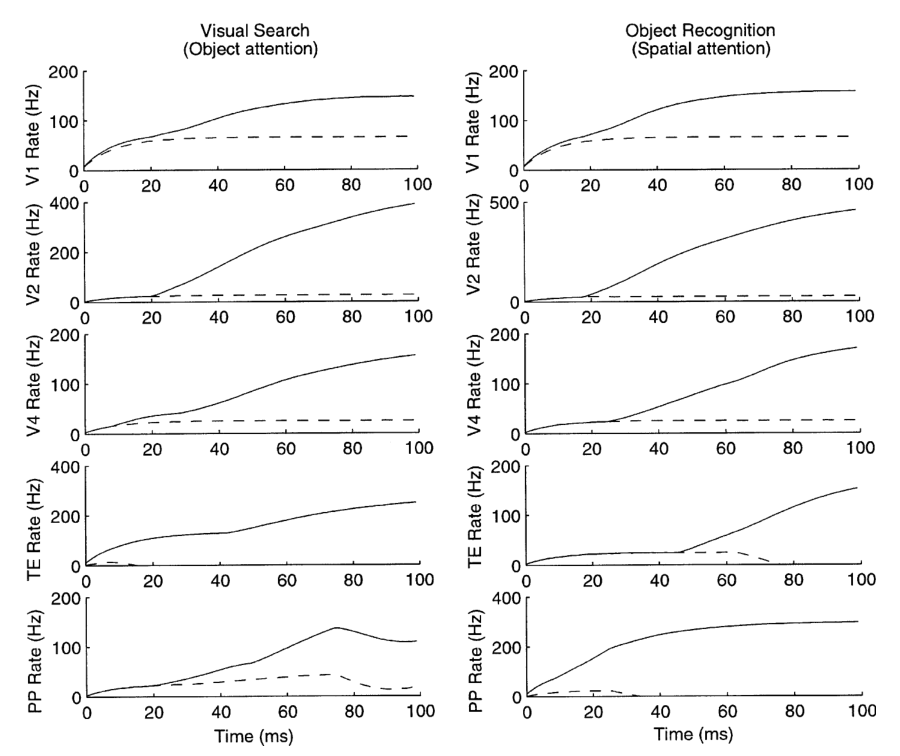
支持图注所述: Fig. 10. Neuronal activity in all modules during: (a) visual search in object attention mode when the aim is to find the ...
verified
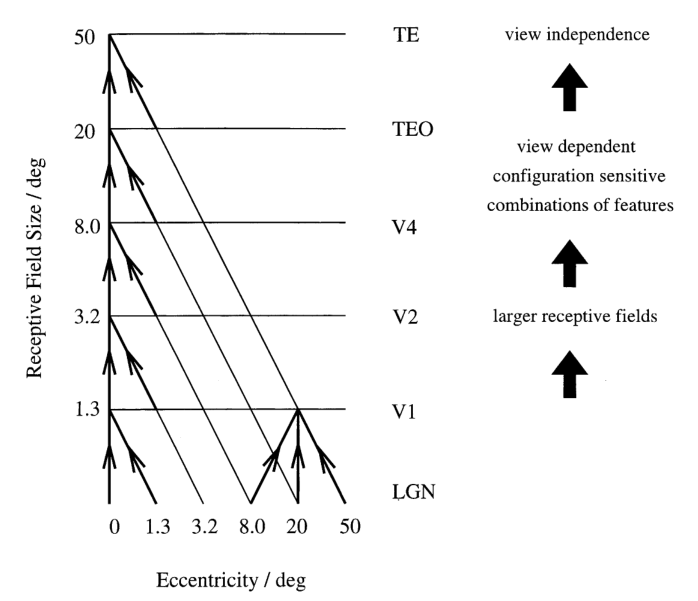
支持图注所述: Fig. 2. Hierarchical convergent forward projection in the ventral what’ path of the visual system achieved by a pyramid...
verified
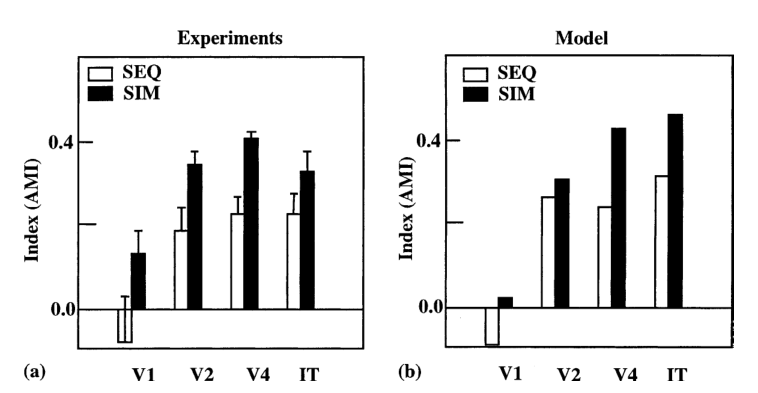
支持图注所述: Fig. 3. Attentional modulation index (AMI) in visual cortex with sequentially and simultaneously presented stimuli. The ...
verified
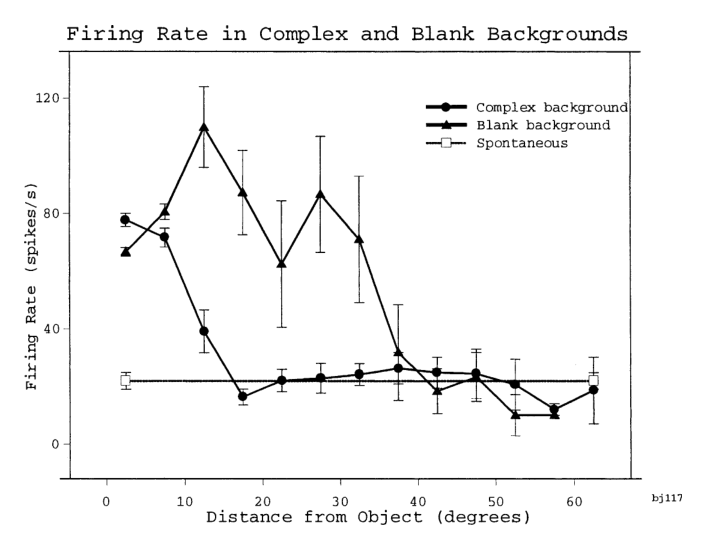
支持图注所述: Fig. 4. Firing of a temporal cortex cell to an effective stimulus presented either in a blank background or in a natural ...
verified
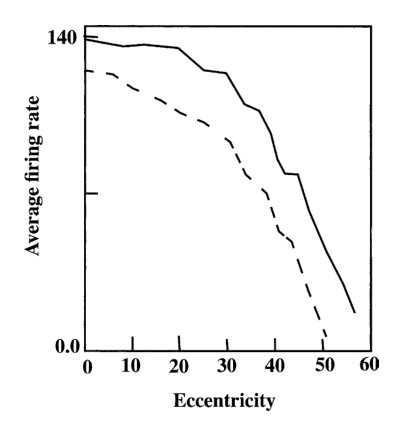
支持图注所述: Fig. 5. Average firing activity of an inferior temporal cortex neuron as
a function of eccentricity from the fovea, in th...
verified
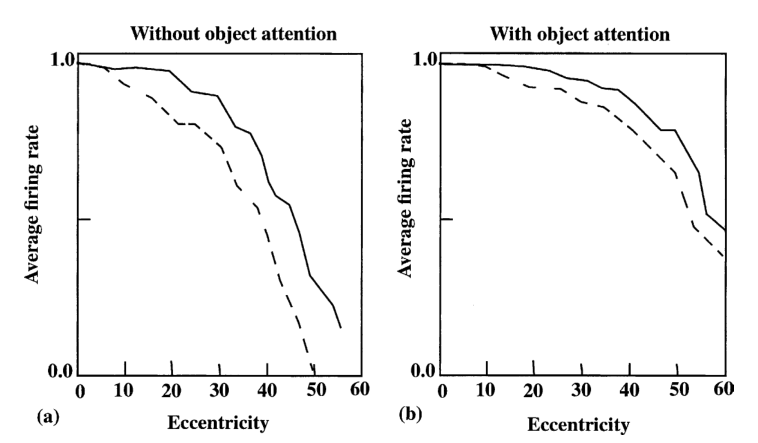
支持图注所述: Fig. 6. Influence of object-based attentional top–down bias from prefrontal area 46v on the effective size of an inferior ...
verified
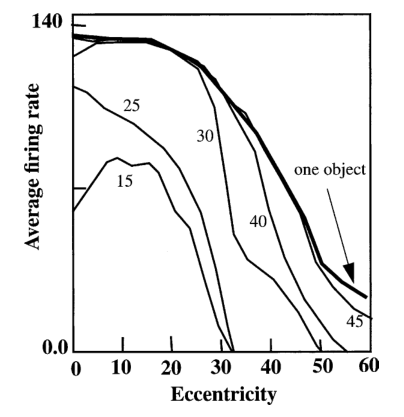
支持图注所述: Fig. 7. The average firing rate of an IT neuron specific for the target
object is plotted as a function of the position of...
verified
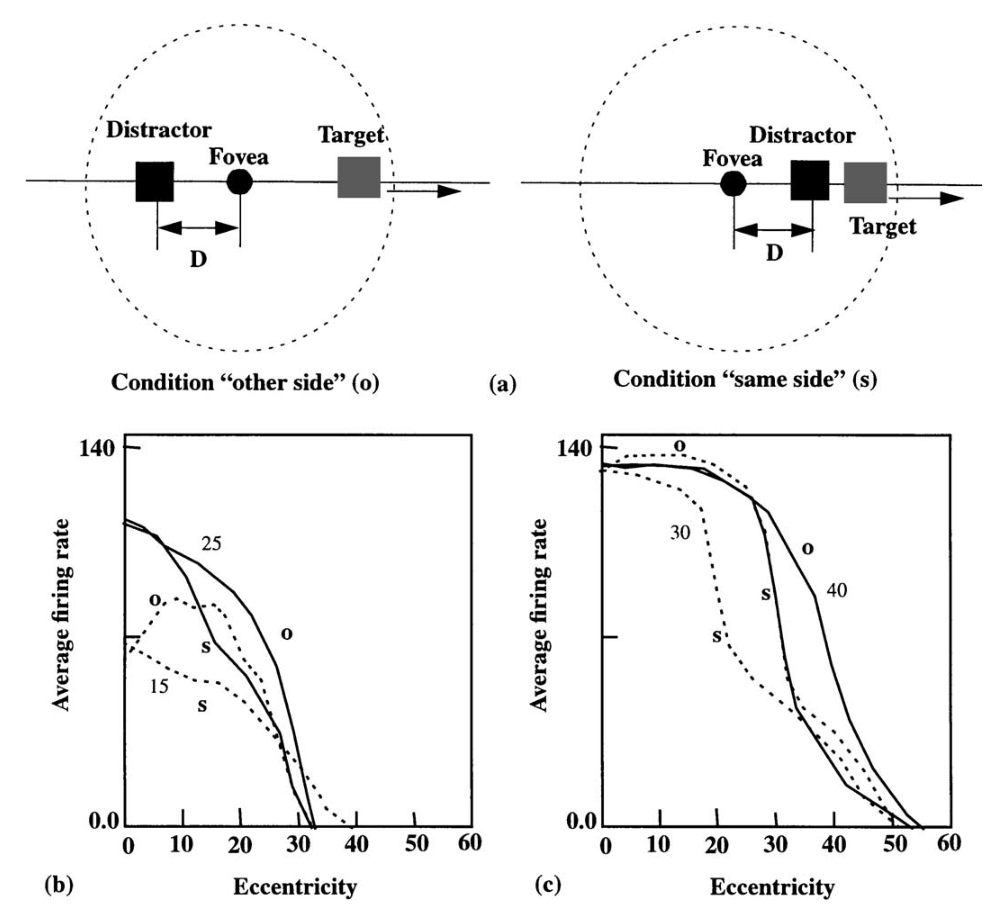
支持图注所述: Fig. 8. (a) Diagrammatic description of condition same side’ (s) and other side’ (o) (see text). (b) and (c) For each ...
verified
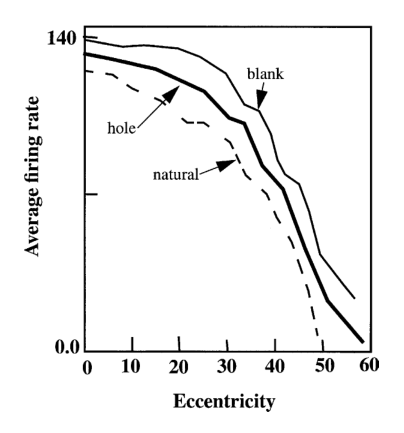
支持图注所述: Fig. 9. Experimental prediction of receptive field size modulation
when a single target object is surrounded locally by a...
verified
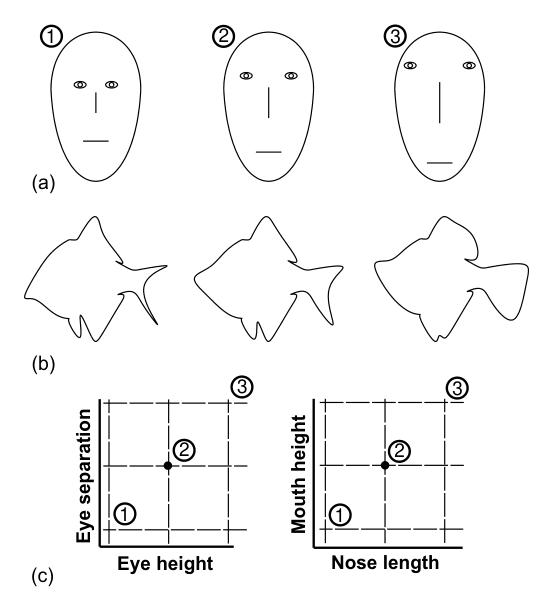
支持图注所述: Fig. 1. Parameterized variation of stimulus features. (a) The first stimulus
set consisted of Brunswik faces differing al...
verified
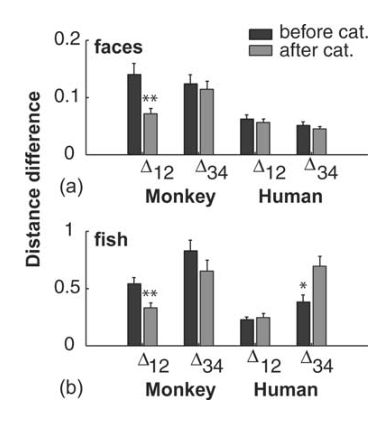
支持图注所述: Fig. 2. Effects of categorization on the representation of the stimuli. (a)
Mean distance difference between psychophysi...
verified
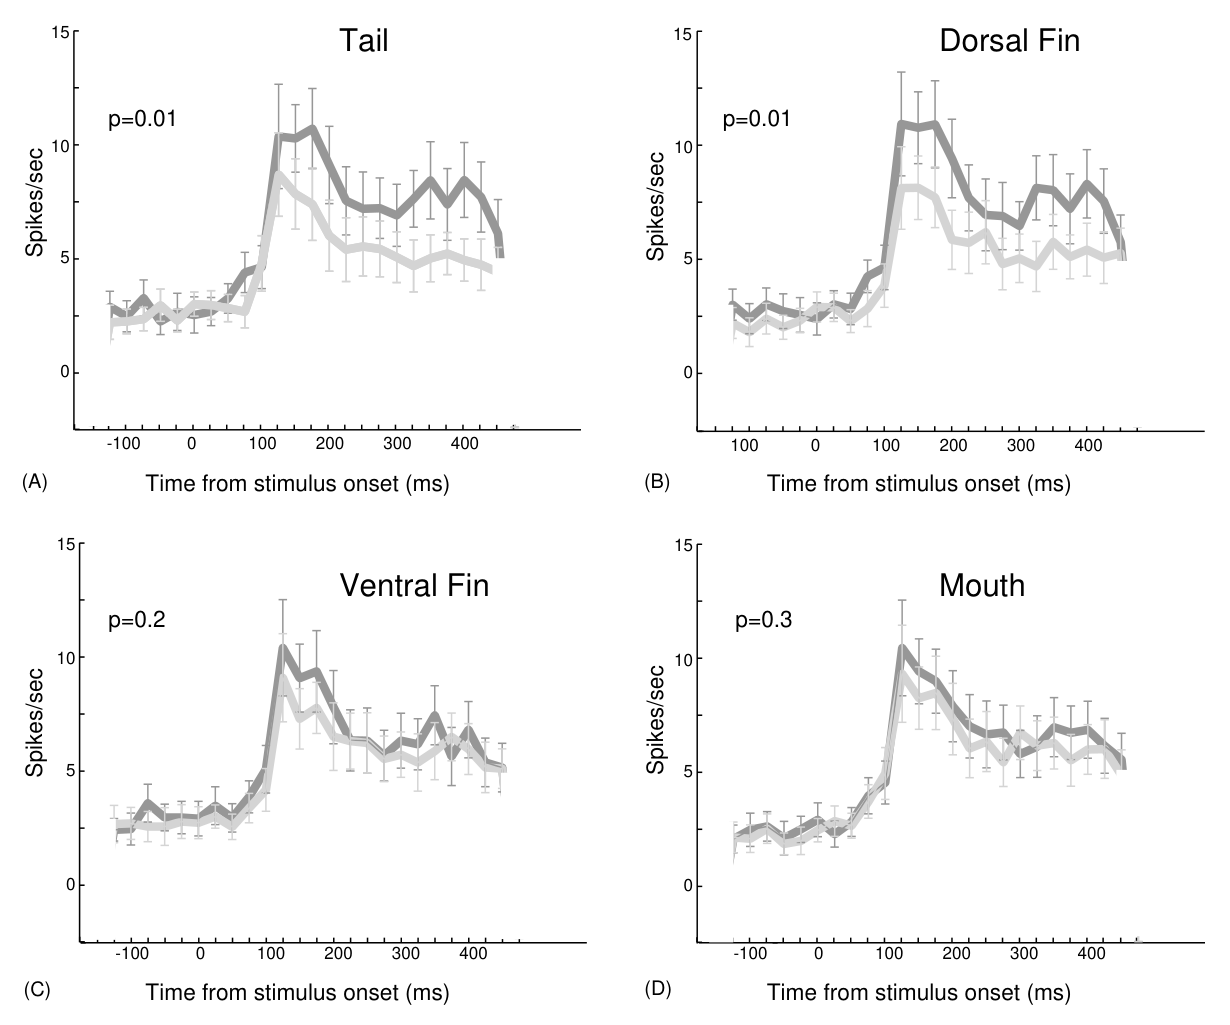
支持图注所述: Fig. 3. Population average for the units recorded with the fish stimuli. The mean firing rate of every cell was normalized...
verified
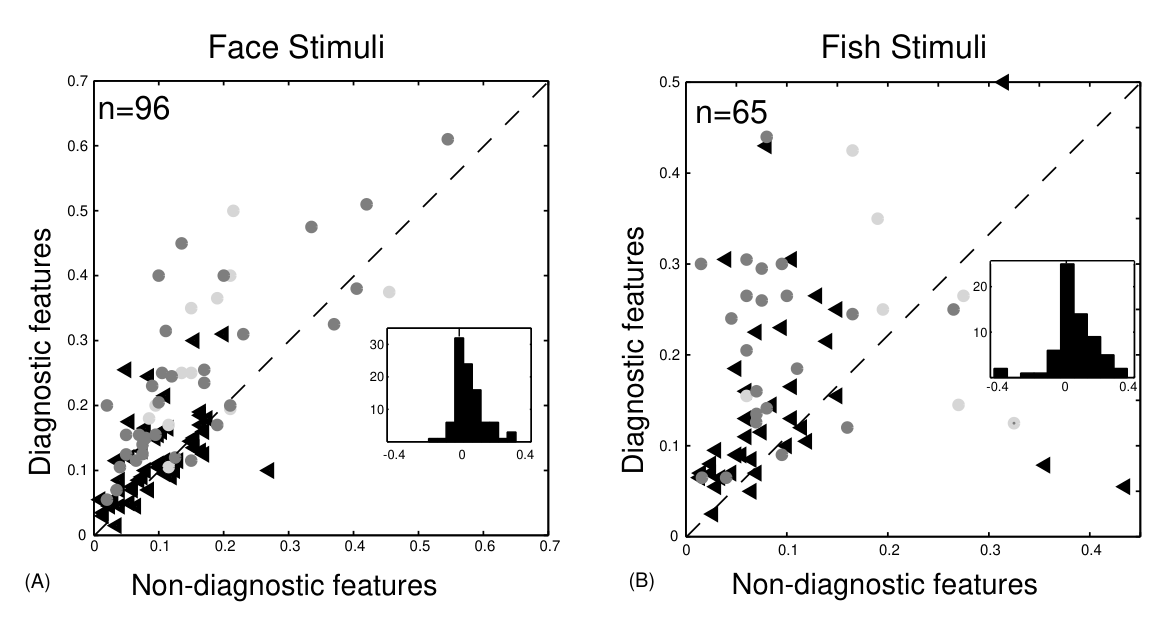
支持图注所述: Fig. 4. Representation of the diagnostic features in the neuronal population for faces (A) and fish (B). Plots of the ave...
verified
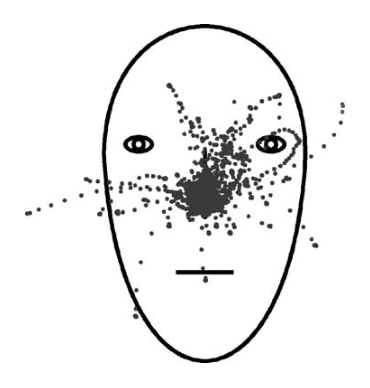
支持图注所述: Fig. 5. Eye movements for 345 trials superimposed on an example face
stimulus. More than 95% of the eye movements were i...
verified
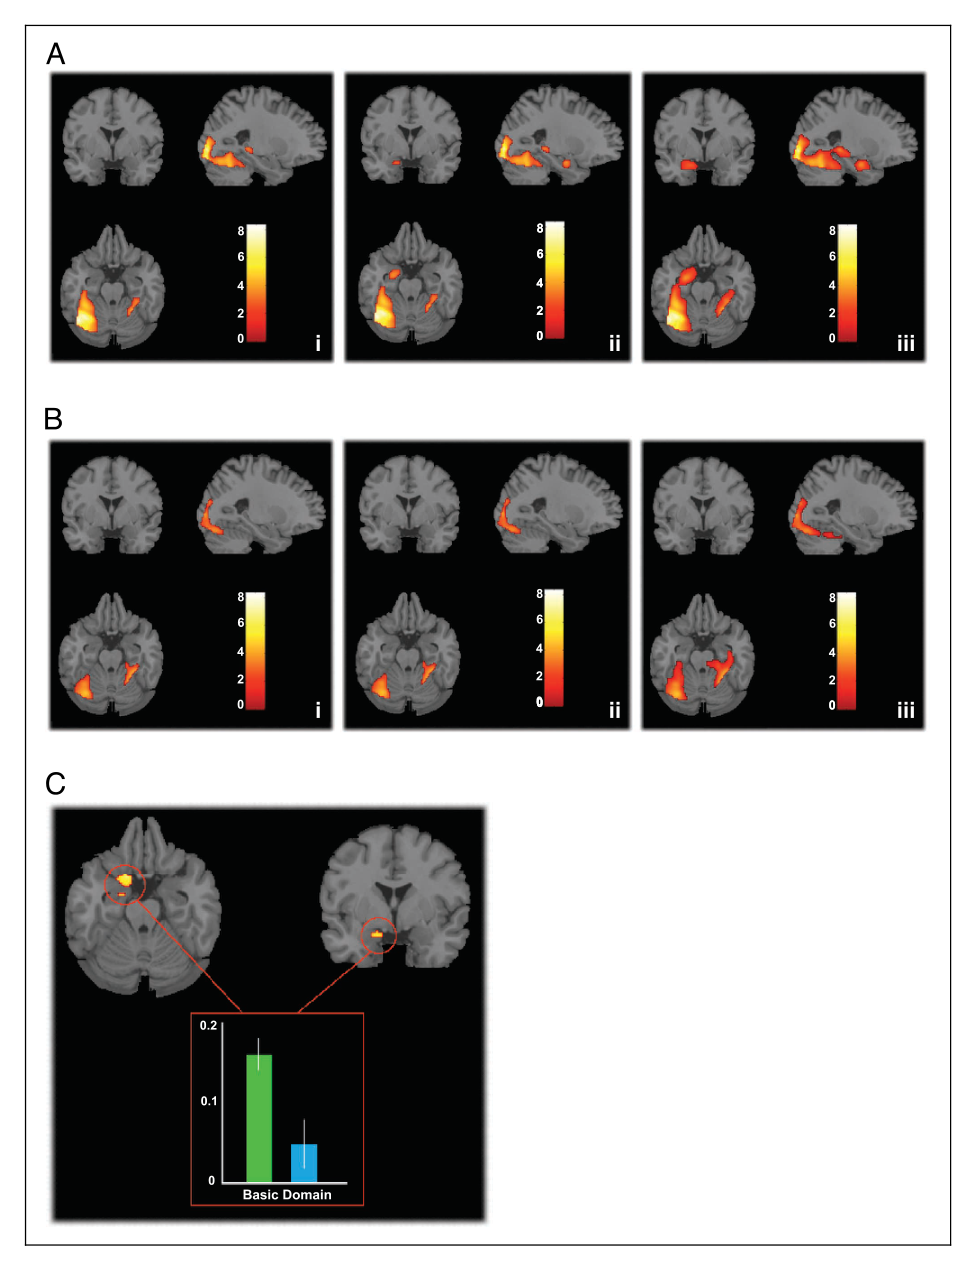
支持图注所述: Figure 1. (A) Significant
activations for the contrast of
basic-level naming minus
baseline are shown
superimposed on a ...
verified
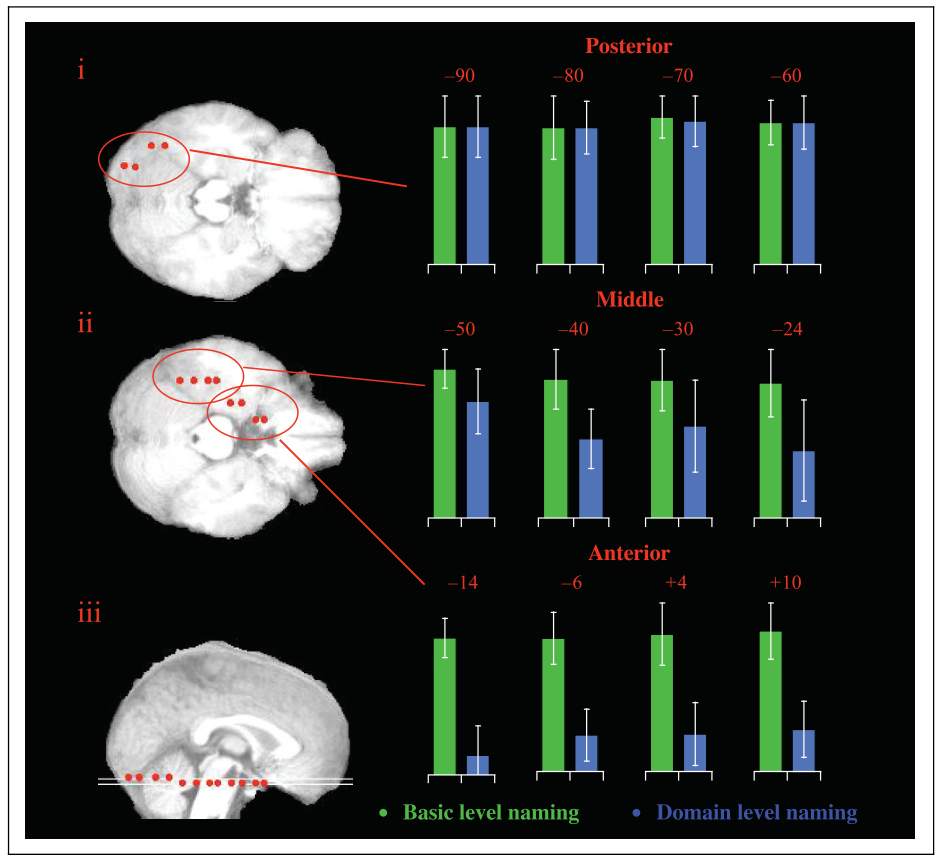
支持图注所述: Figure 2. Plots of signal
change (with standard error
bars) for basic- and domain-
level naming relative to baseline
at ...
verified
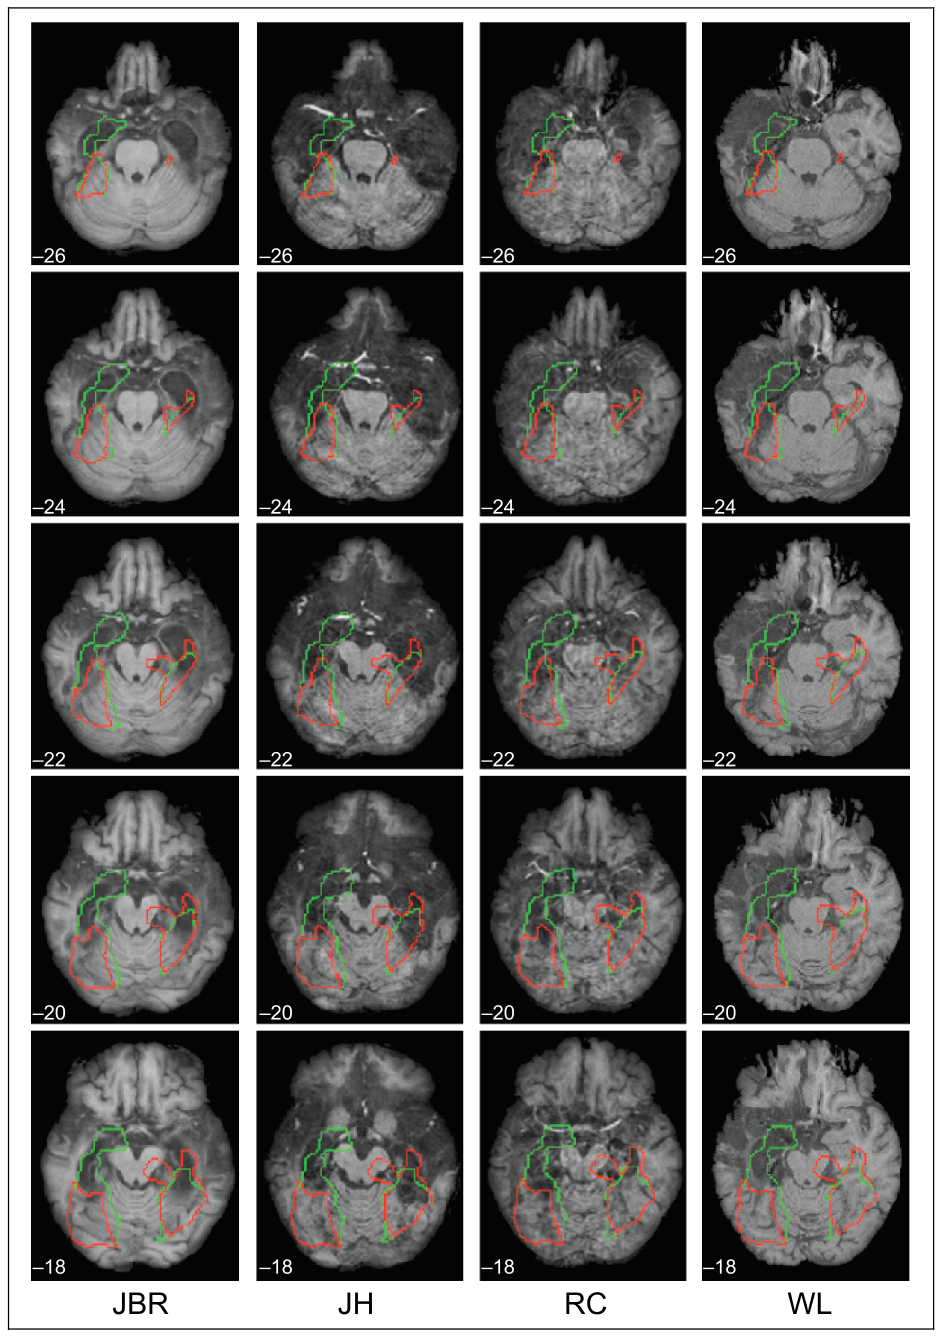
支持图注所述: Figure 3 shows the T1 anatomical images obtained on a
2-T MR scanner for the four HSE patients.1 The images
were transfo...
verified
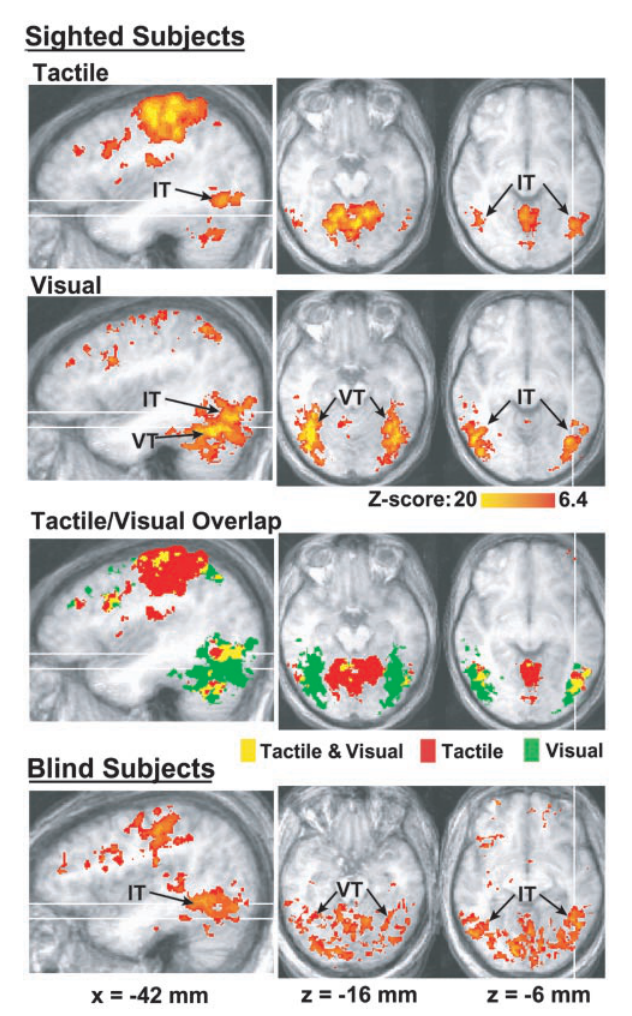
支持图注所述: Fig. 1.
Brain areas that responded during tactile andor visual object
perception in sighted subjects and during tactile...
verified
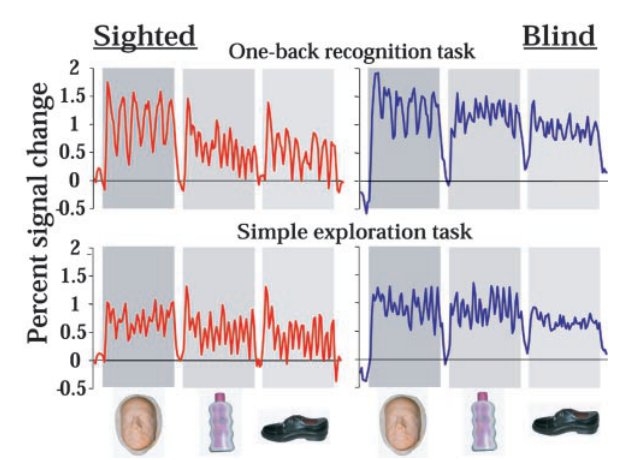
支持图注所述: Fig. 2.
Mean time series, averaging across subjects, voxels, and blocks, for the
response in inferior temporal cortex du...
verified
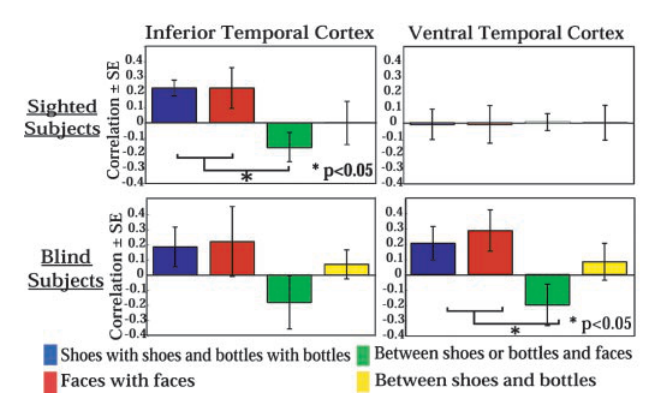
支持图注所述: Fig. 3.
Correlations between patterns of neural response evoked by two
tactile recognition tasks (one-back repetition ta...
verified
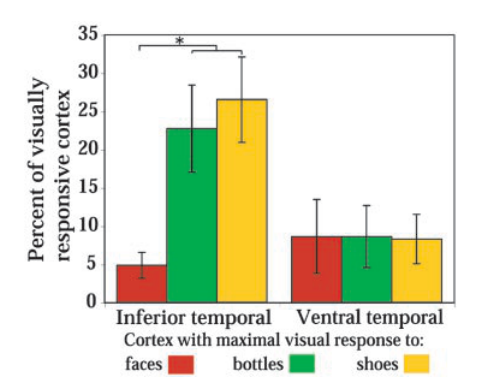
支持图注所述: Fig. 4.
Proportion of visually responsive cortex with maximal responses to
faces, bottles, or shoes that was also activa...
verified
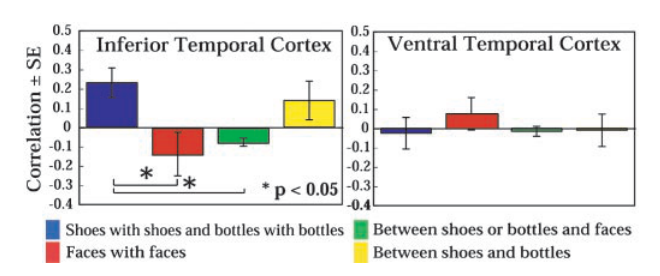
支持图注所述: Fig. 5.
Crossmodal correlations between category-related patterns of re-
sponse during visual and tactile recognition. E...
verified
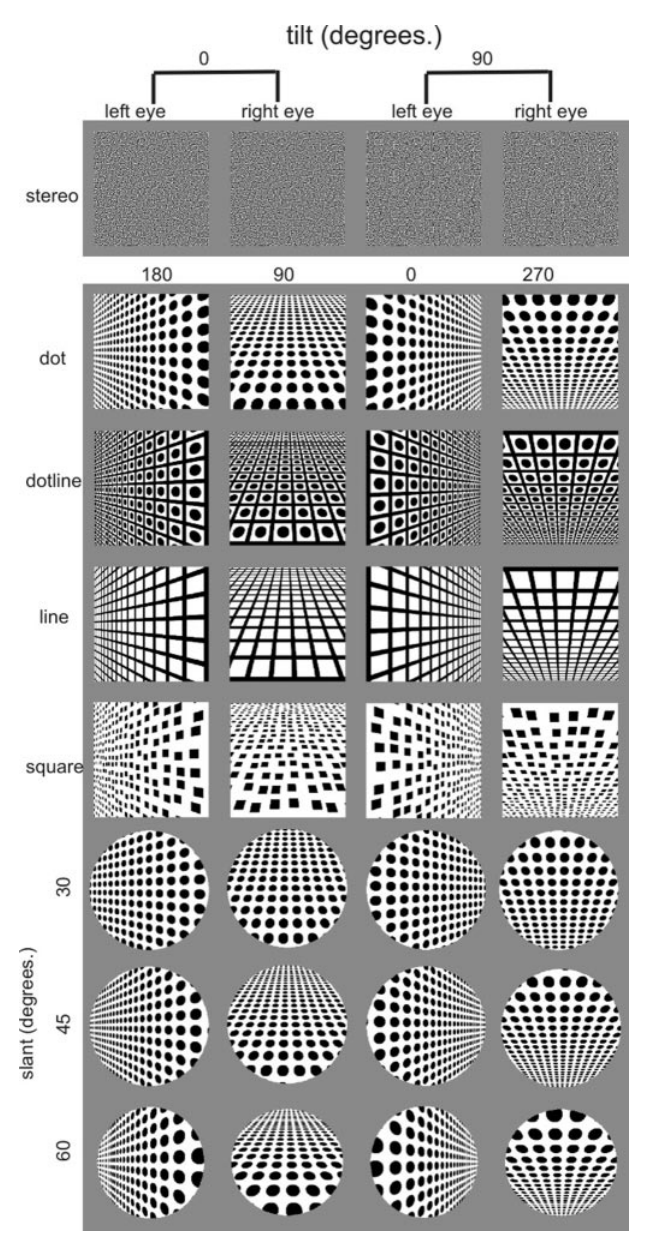
支持图注所述: Figure1.
Stimuli.Top,Twoexamplesofapairofrandomdotpatternsthat,whenpresented
dichoptically,producedisparitygradientsofth...
verified
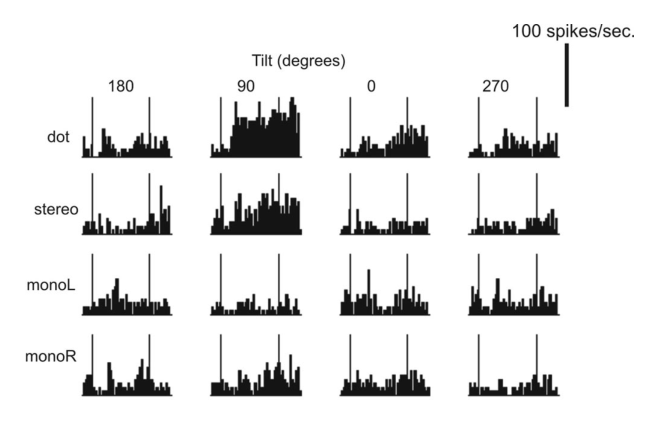
支持图注所述: Figure 2.
Responses of a single inferior temporal neuron to binocular presentations of the
dottextures(toprow)andstereos...
verified
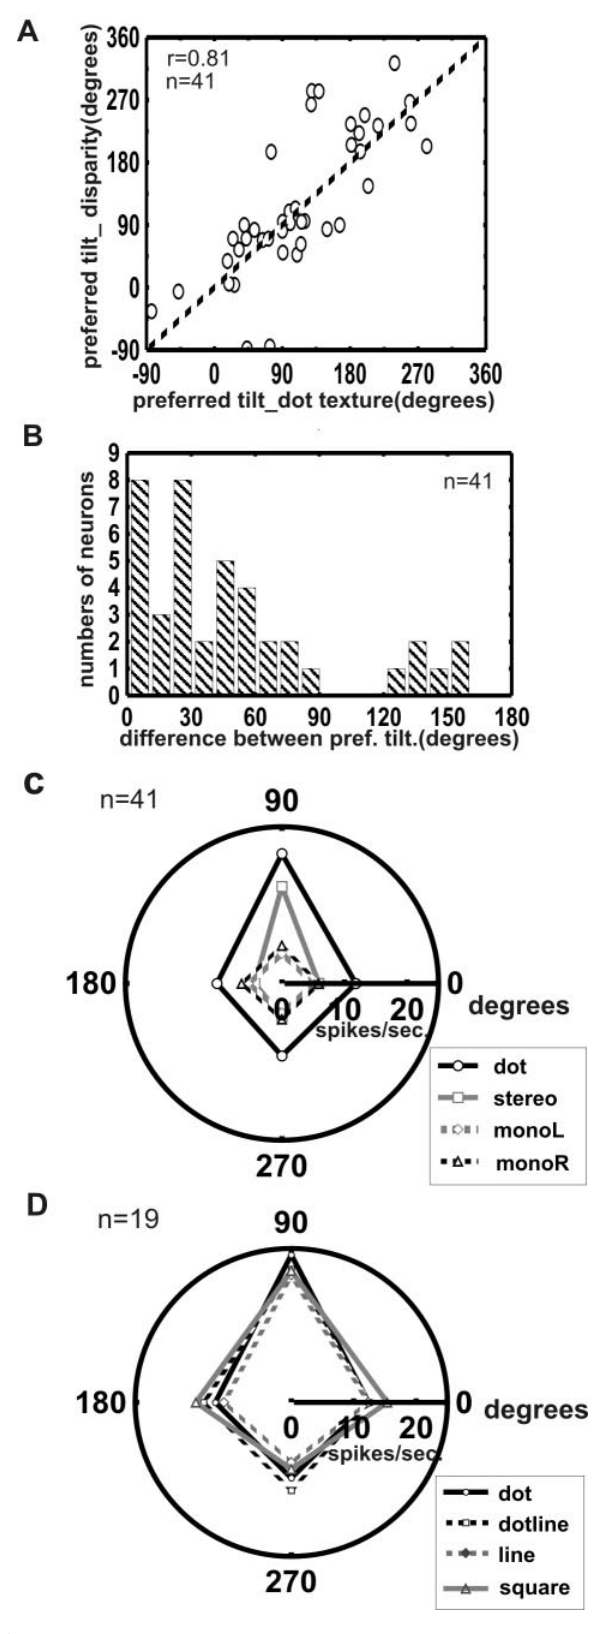
支持图注所述: Figure3.
Thetuningofinferiortemporalneuronstotiltportrayedbydifferenttexturesanddis-
parity gradients is compared. A, Co...
verified
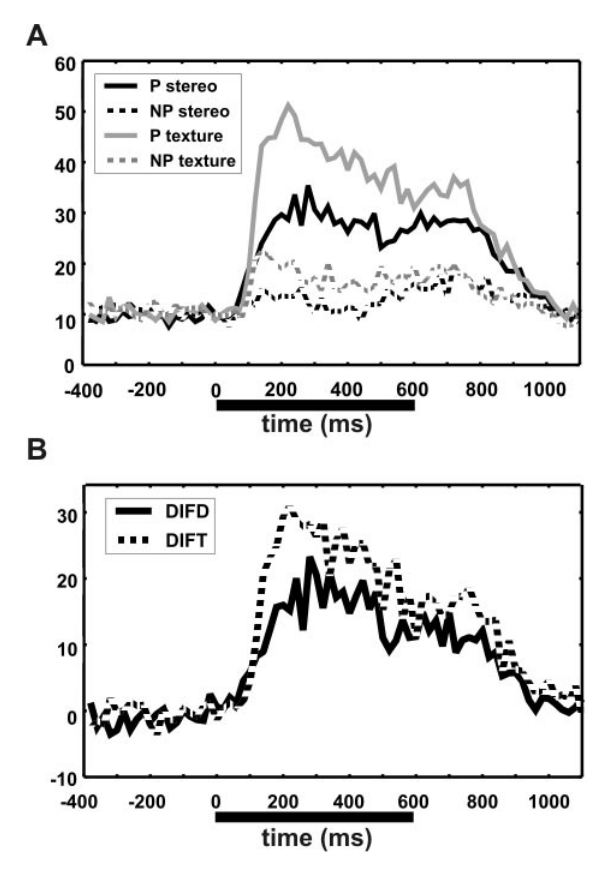
支持图注所述: Figure4.
Populationanalysisoftimecoursesofresponsestothedisparity-anddottexture-
definedsurfacesfor41neuronstiltselectiv...
verified
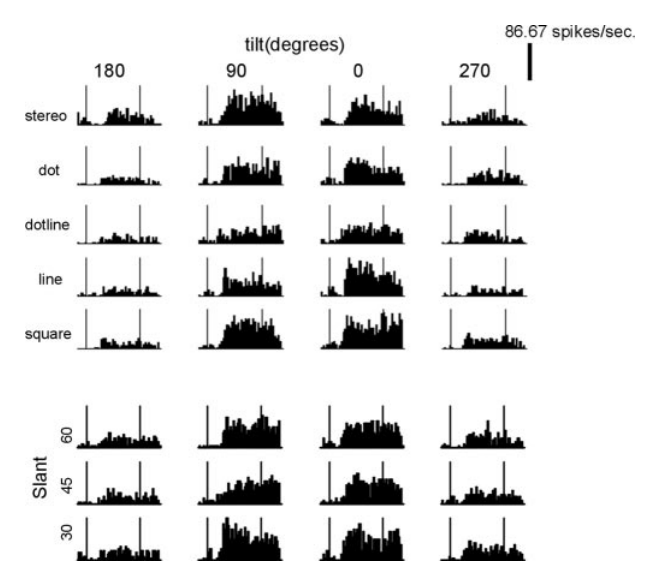
支持图注所述: Figure 5.
Responses of a single inferior temporal neuron to binocular presentations of the
texture gradient and disparit...
verified
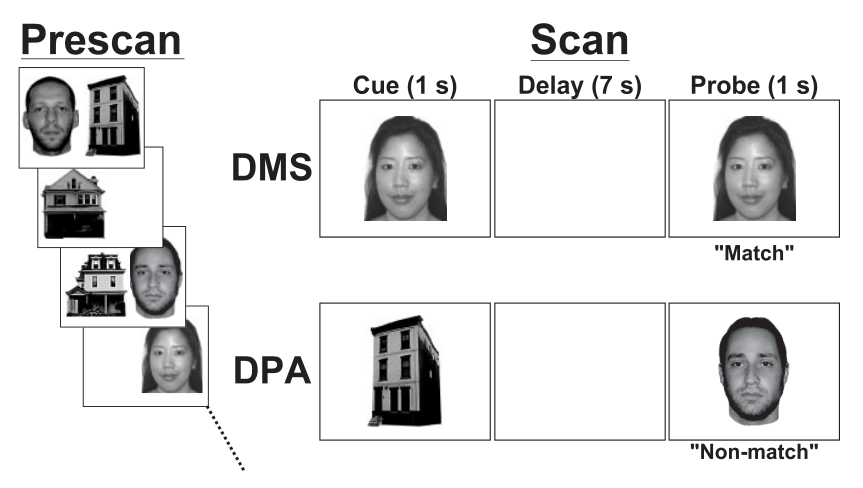
支持图注所述: Figure1.
Experimentaldesign.Duringtheprescanphase,subjectslearnedasetoffaces,houses,andface–housepairs.During
the scan p...
verified
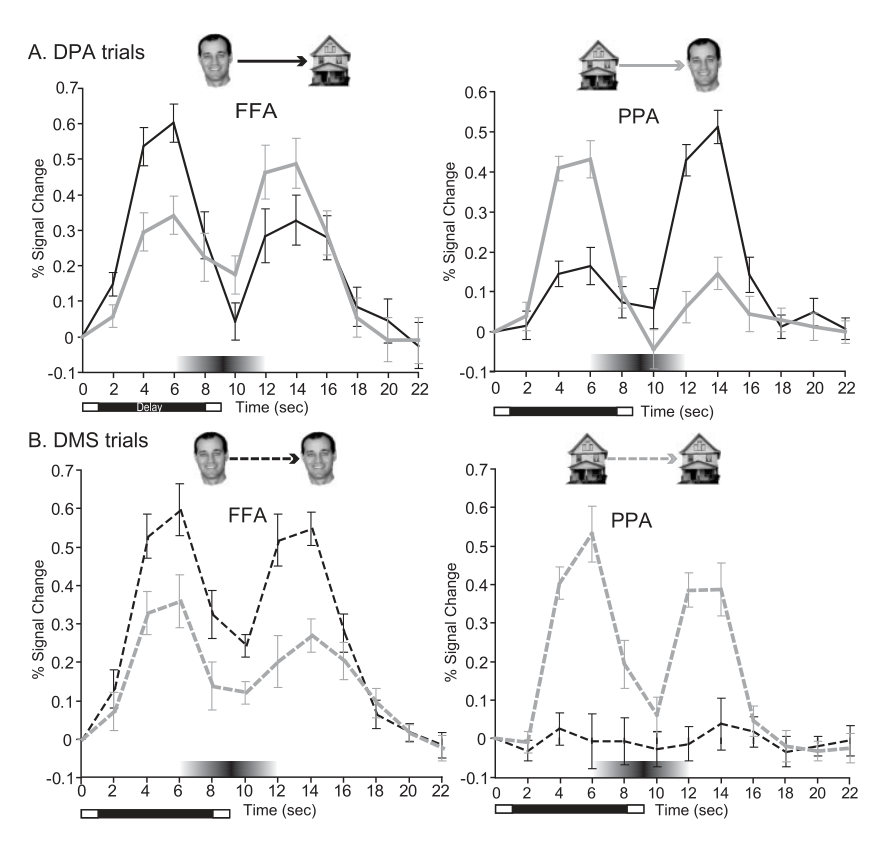
支持图注所述: Figure2.
TimecourseofinferiortemporalactivityduringDPAandDMStrials.A,B,Graphsdepictthetimecourseofactivation
during DPA ...
verified
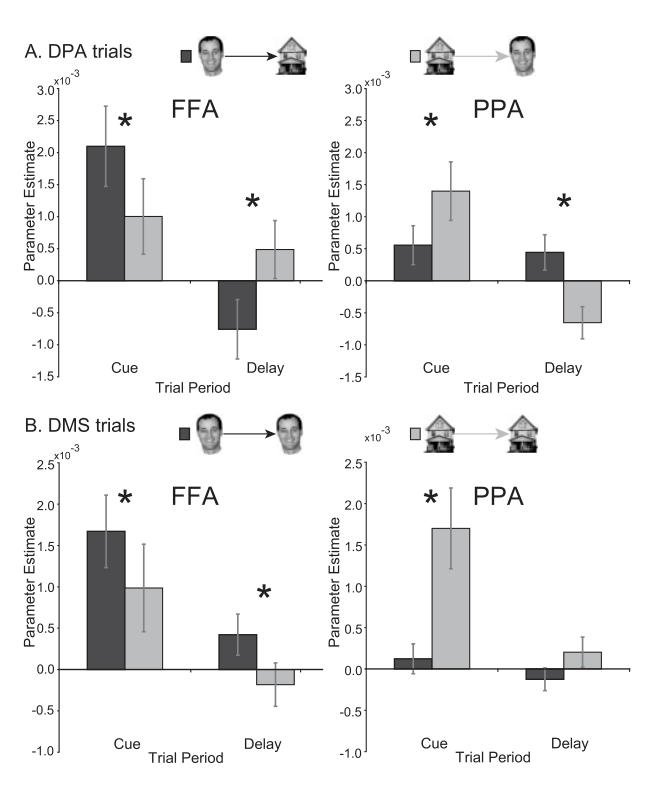
支持图注所述: Figure3.
Mnemonicactivityininferiortemporalcortexreflectedthetypeofobjectthatwas
active in memory. Mean values of parame...
verified
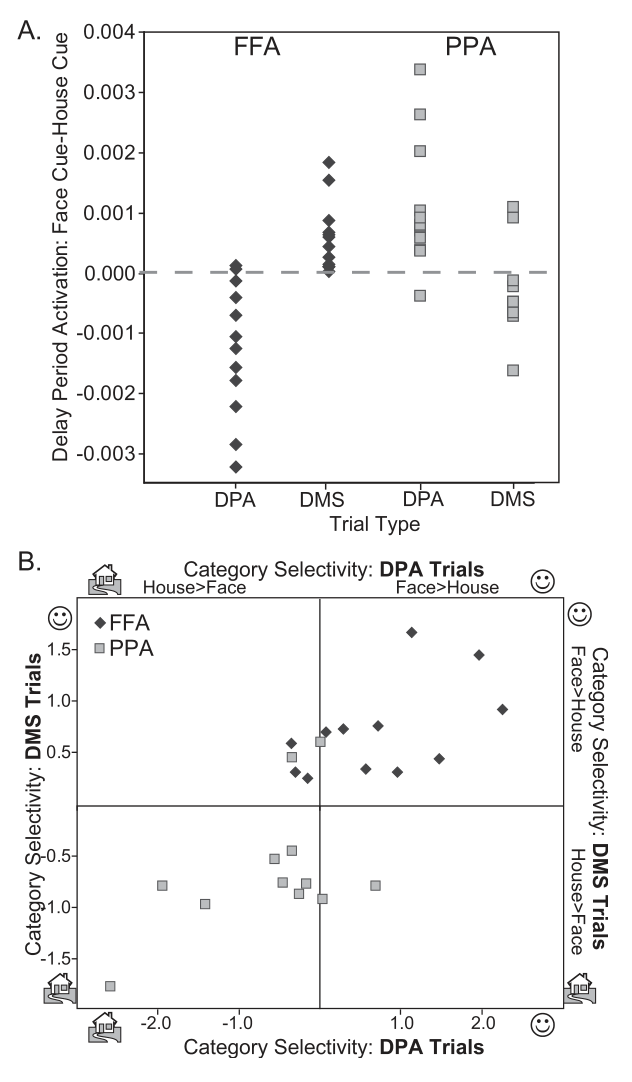
支持图注所述: Figure4.
Categoryselectivityduringassociativerecallandworkingmemorymaintenanceis
robust and positively correlated. A, A ...
verified
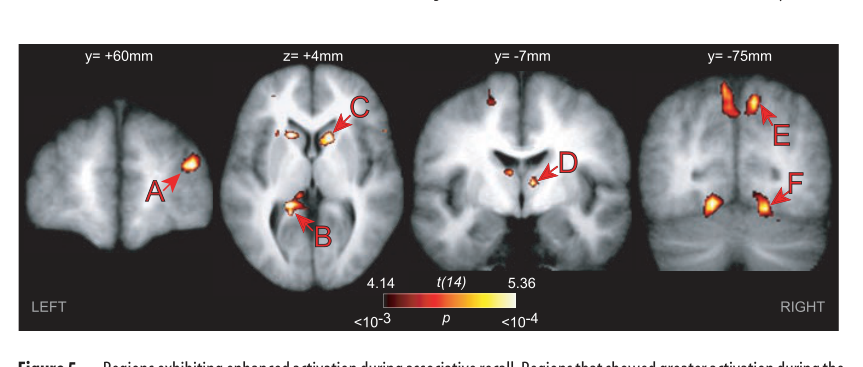
支持图注所述: Figure5.
Regionsexhibitingenhancedactivationduringassociativerecall.Regionsthatshowedgreateractivationduringthe
cue peri...
verified
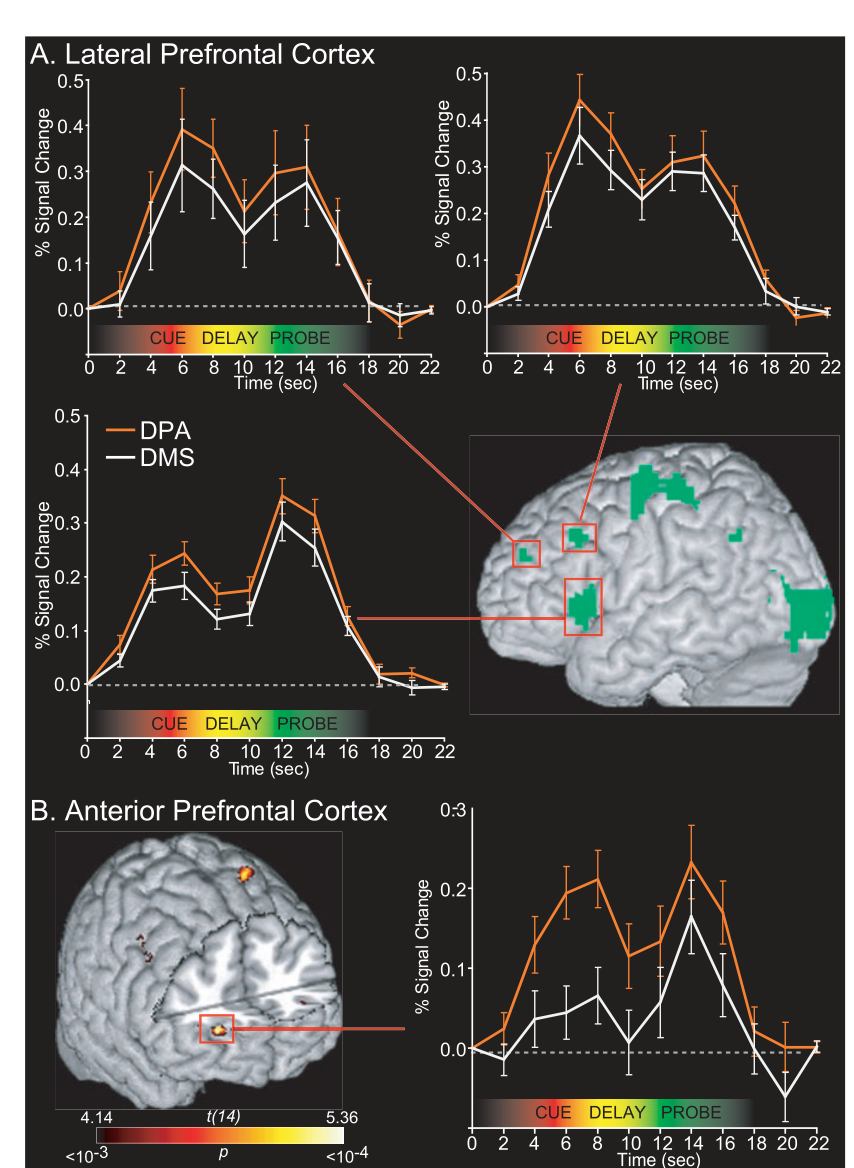
支持图注所述: Figure6.
ComparisonofresponseswithinlateralandanteriorPFCsubregions.A,Regionsthatshoweddelay-periodactivation
duringboth...
verified
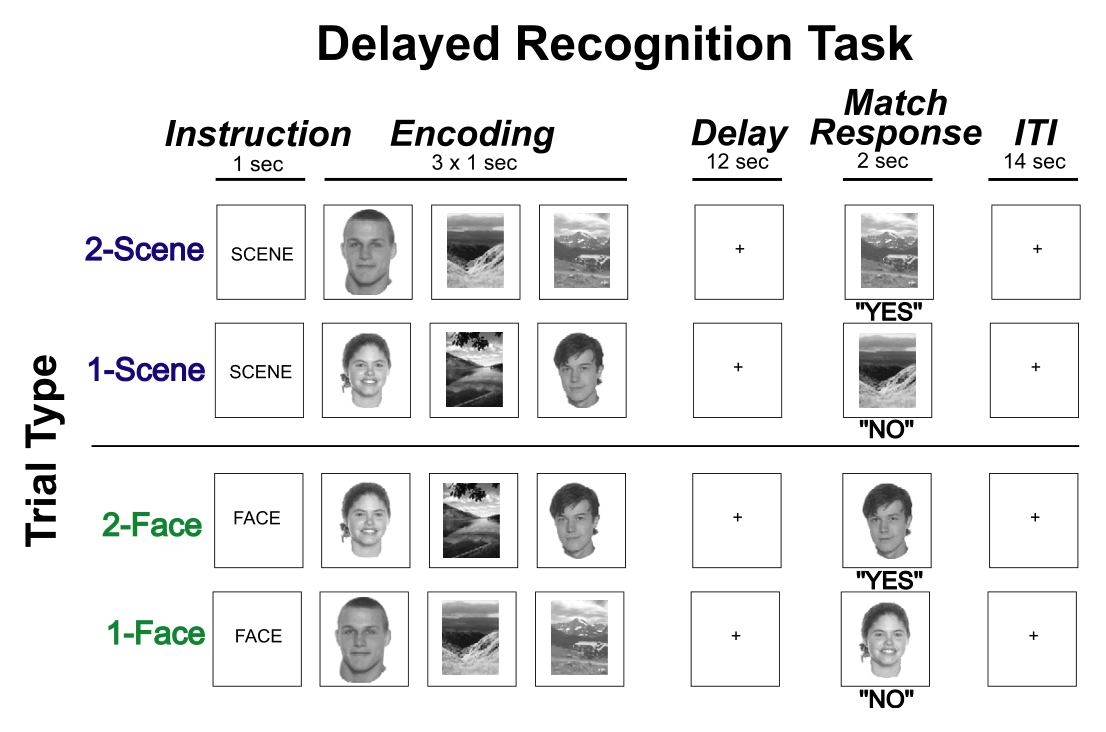
支持图注所述: Fig. 1. Behavioral paradigm and task design. On each trial, subjects were shown a sequence of three images for 1 s each....
verified
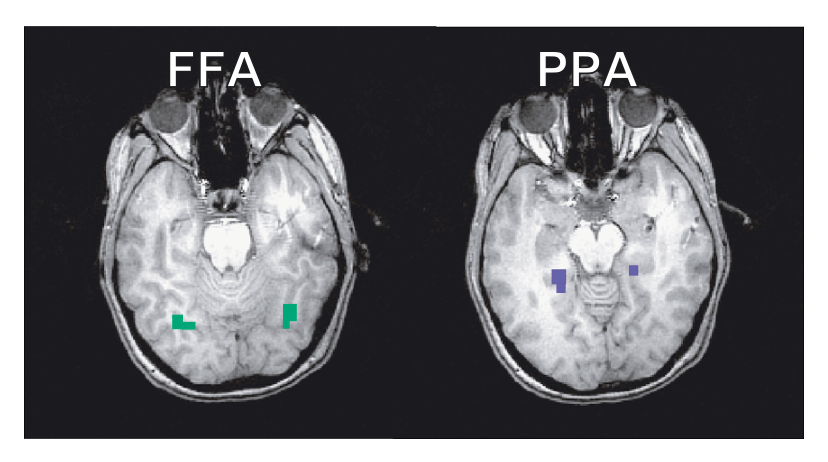
支持图注所述: Fig. 2. Locations of the FFA and PPA ROIs are shown on axial slices for one representative subject....
verified
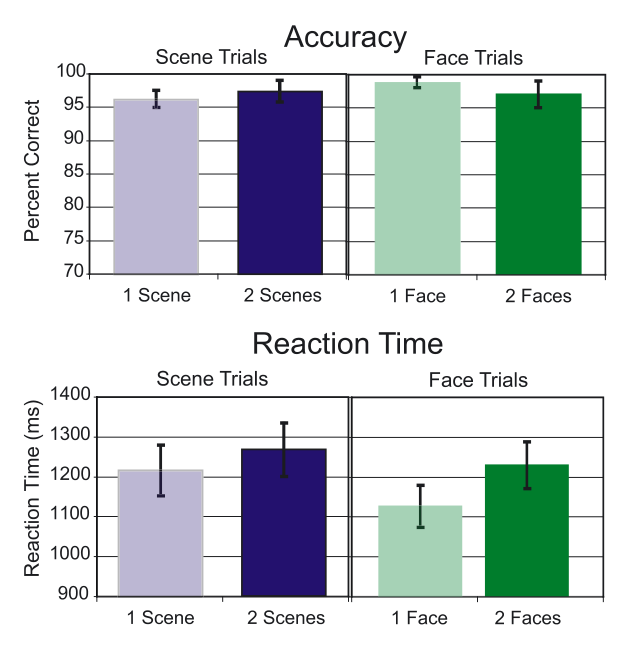
支持图注所述: Fig. 3. Behavioral results. Bar graphs show mean accuracy (top) and
reaction times (bottom) for each trial type. Error b...
verified
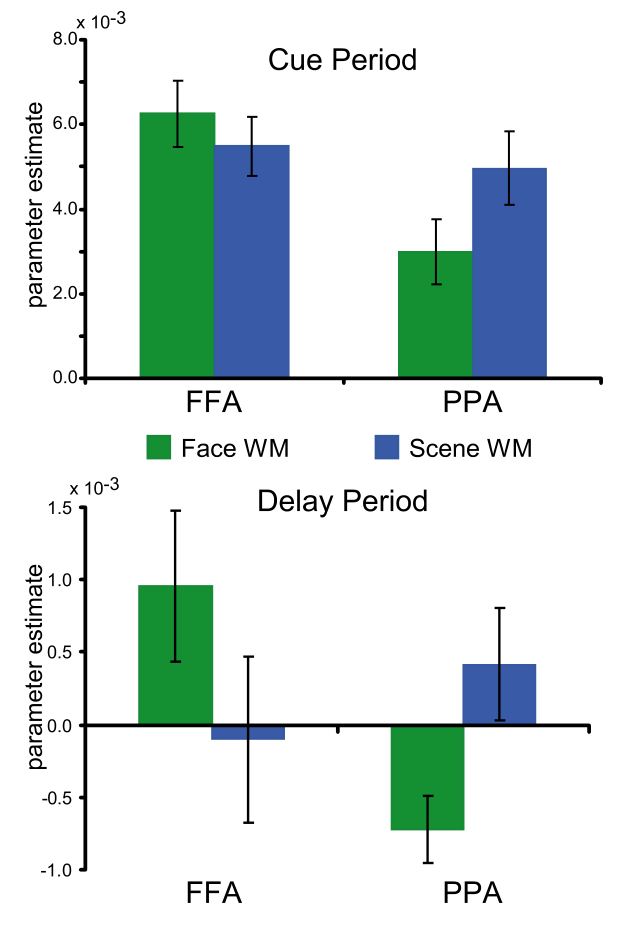
支持图注所述: Fig. 4. Modulation of inferior temporal activity associated with active
encoding and maintenance. The bar graphs show pa...
verified
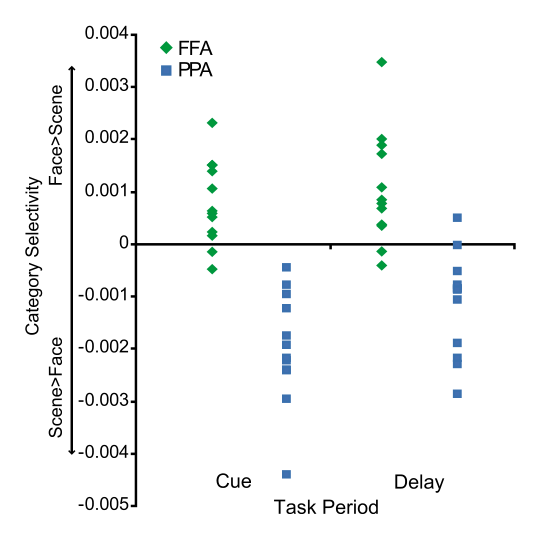
支持图注所述: Fig. 5. Category selectivity of inferior temporal activity during WM
encoding and maintenance. A scatter plot shows the ...
verified
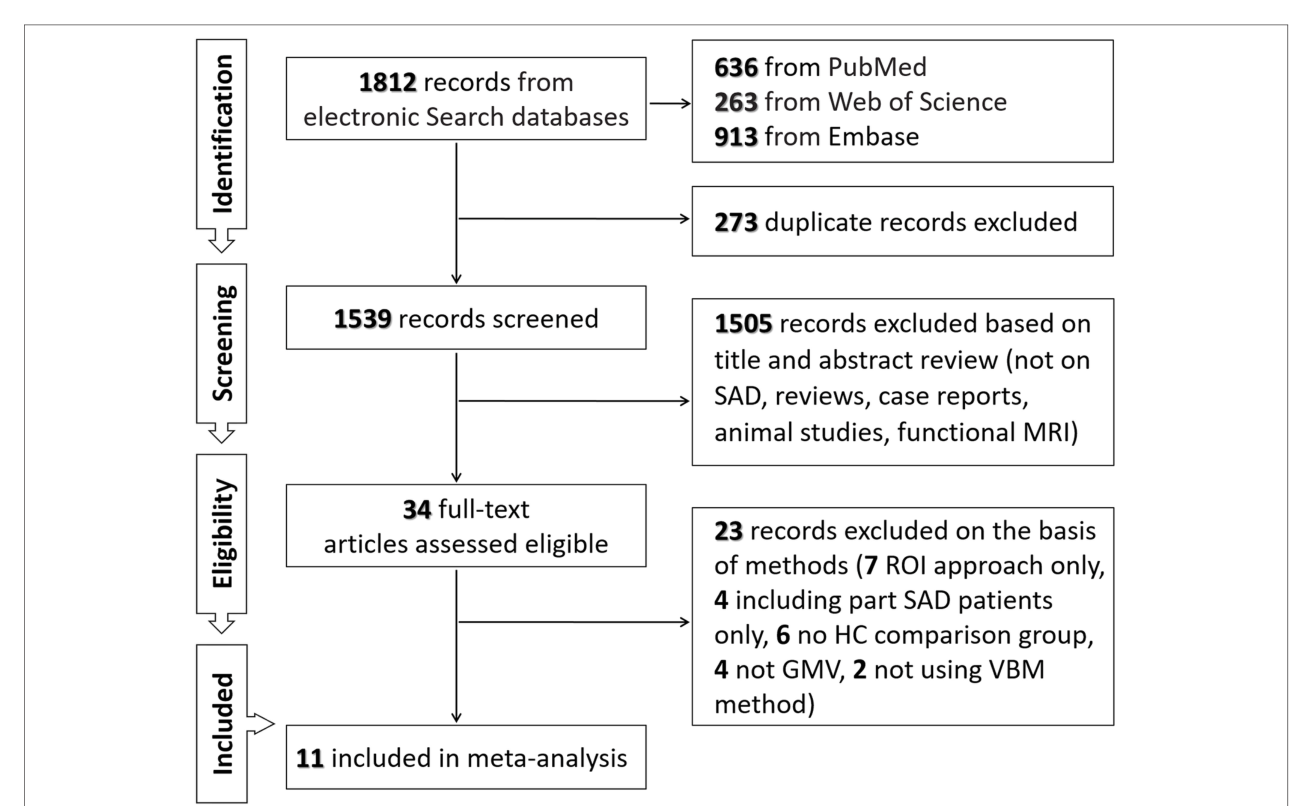
支持图注所述: FIGURE 1 | Flowchart of the search strategy and inclusion of studies....
verified
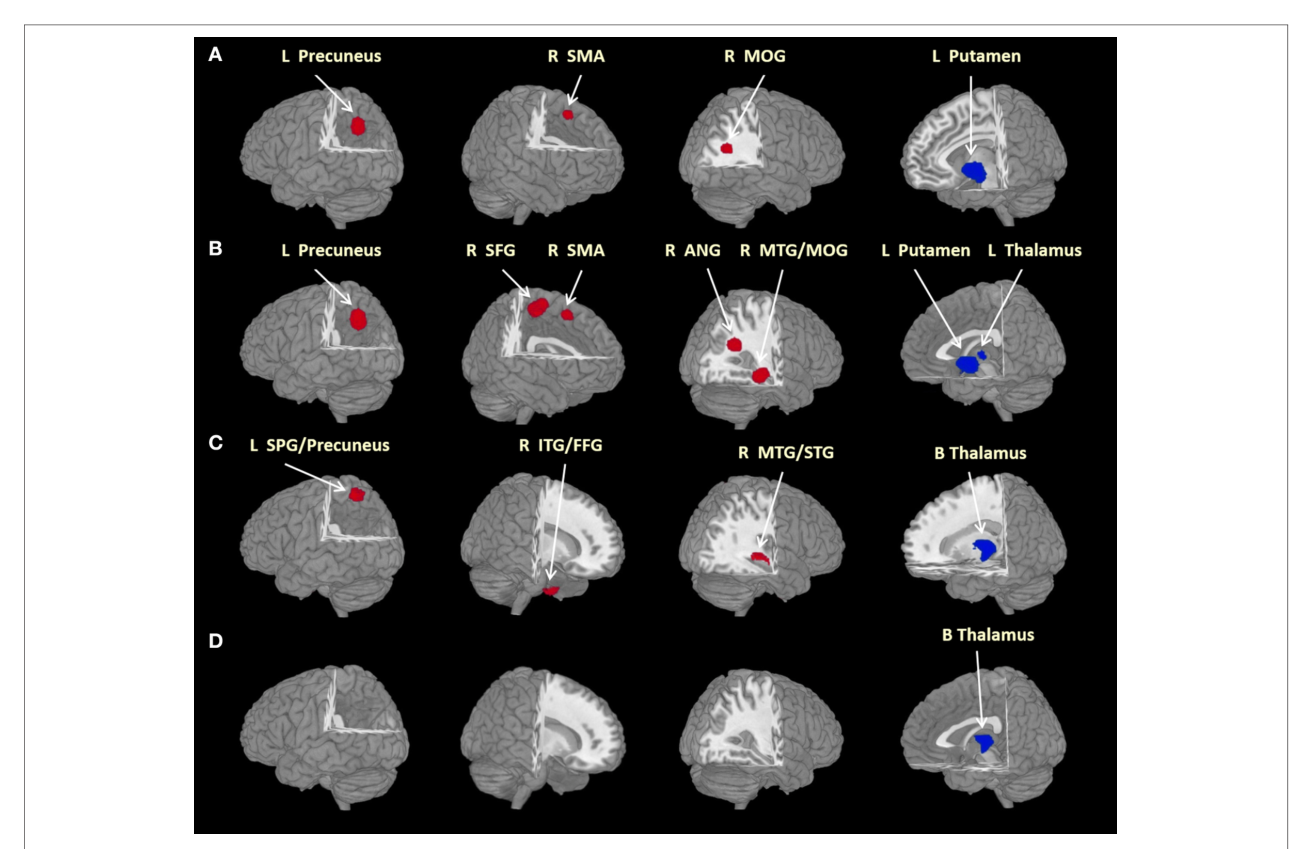
支持图注所述: FIGURE 2 | Brain regions differed significantly between groups. Areas of larger (red) and smaller (blue) brain GMVs in pa...
verified
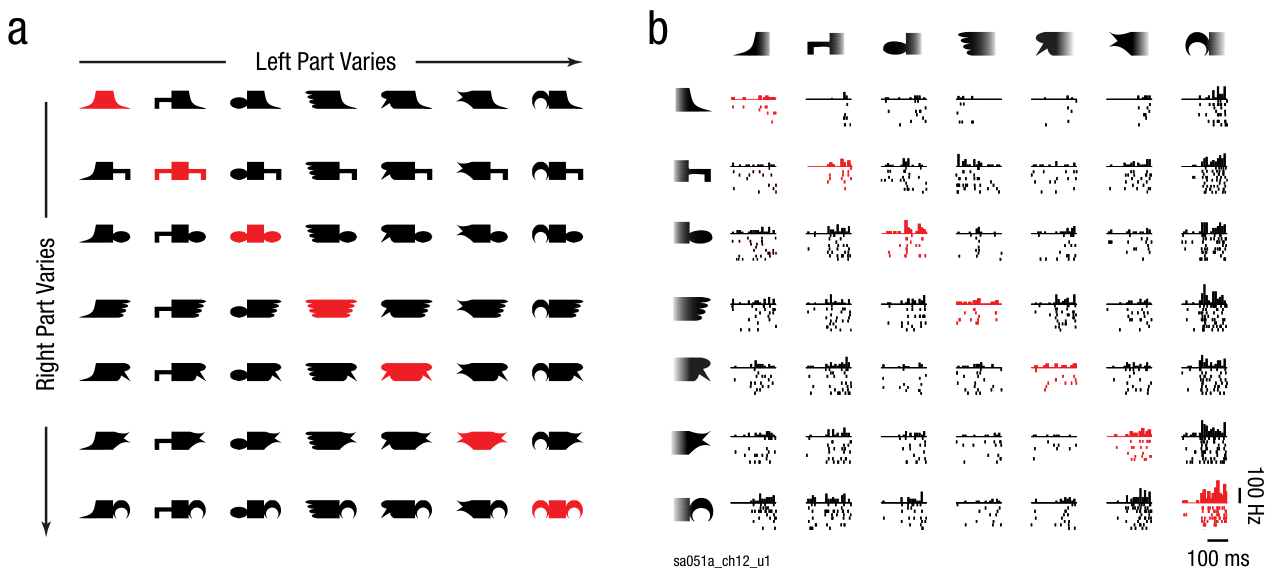
支持图注所述: Fig. 1. Stimuli (a) and example responses in monkey inferior temporal (IT) cortex (b). Each neuron was tested with hori...
verified
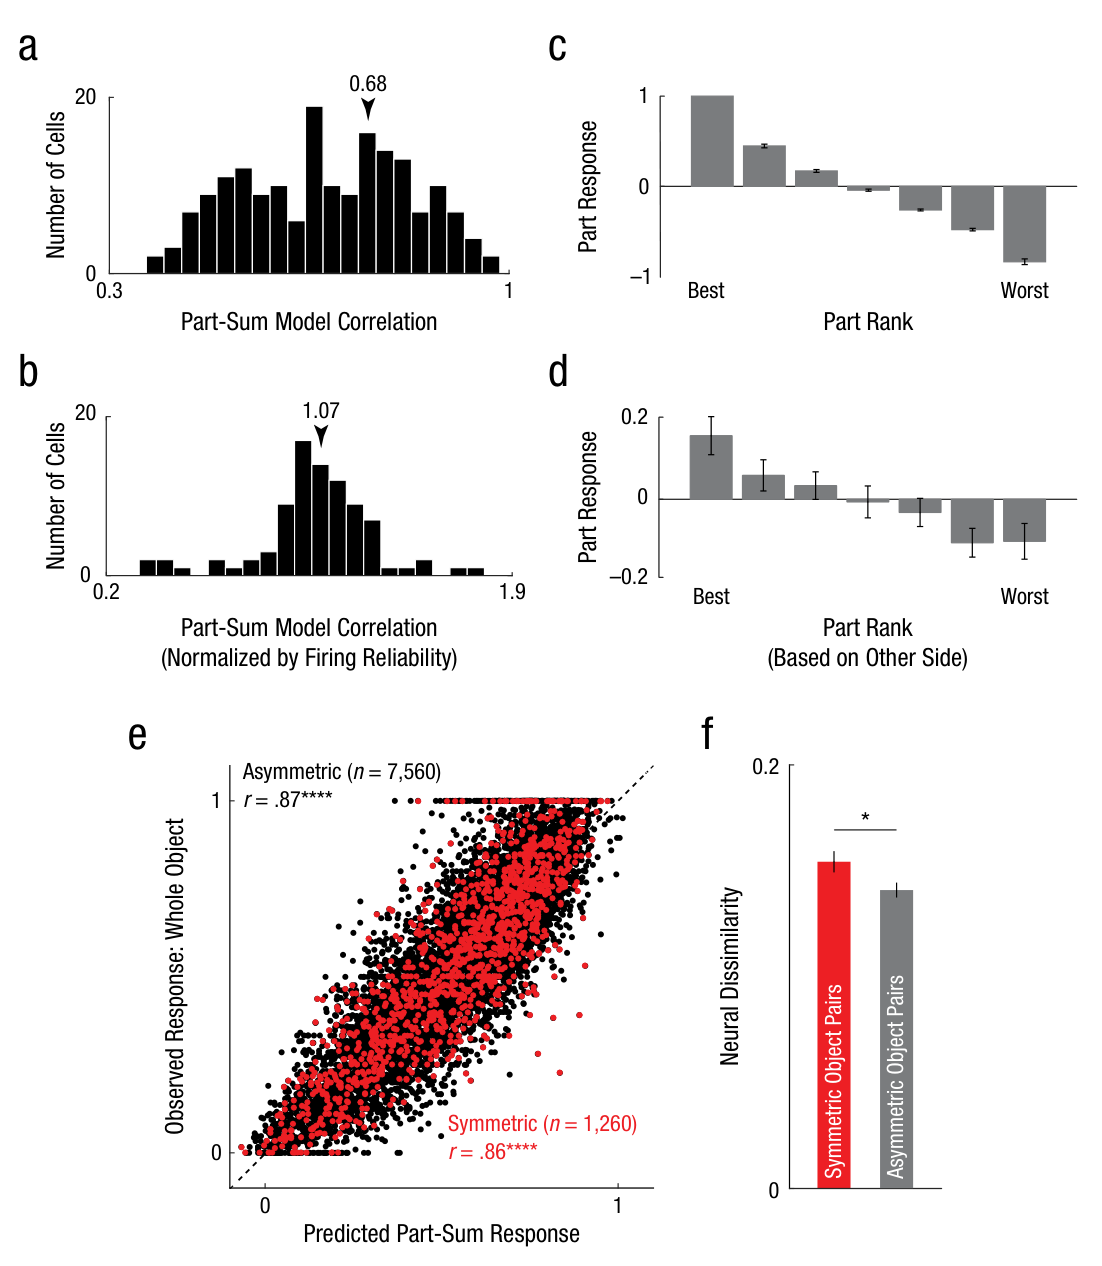
支持图注所述: Fig. 2. Part summation in symmetric and asymmetric objects in monkey inferior temporal (IT) neurons. The histogram
in (...
verified
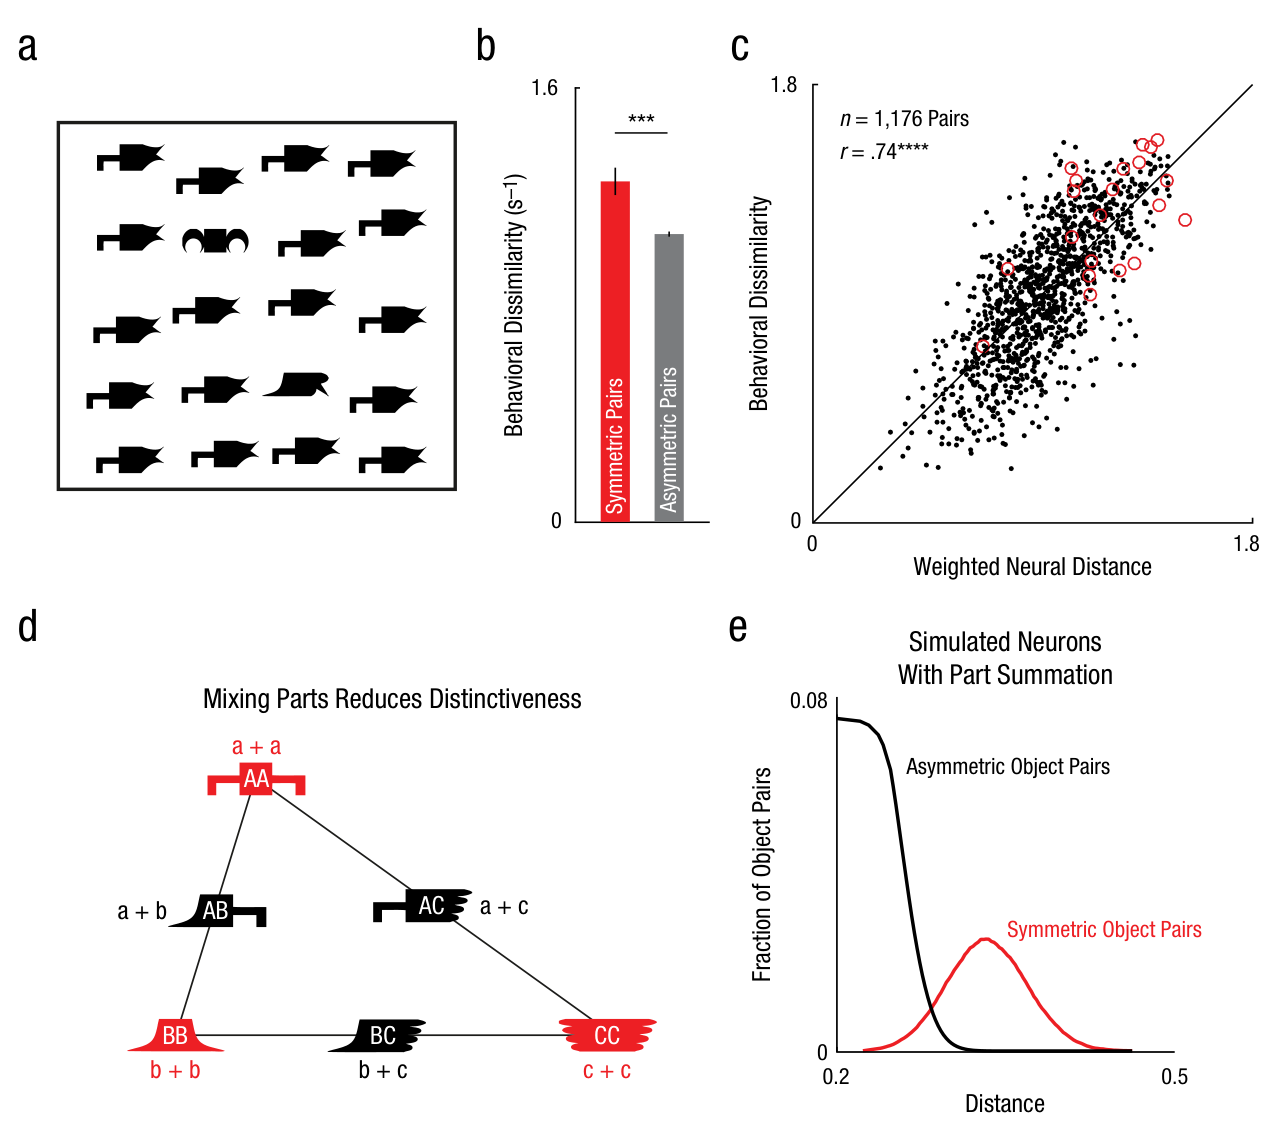
支持图注所述: Fig. 3. Distinctiveness of symmetric objects as a result of part summation. The example search array from Experiment 1 ...
verified
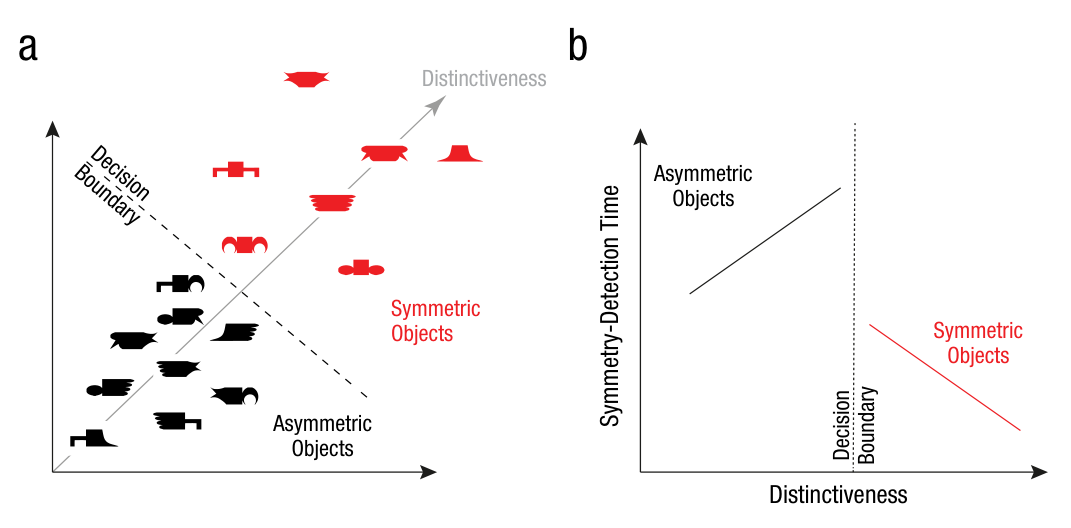
支持图注所述: Fig. 4. Hypothetical relation between distinctiveness and symmetry perception. Part summation causes symmetric
objects ...
verified
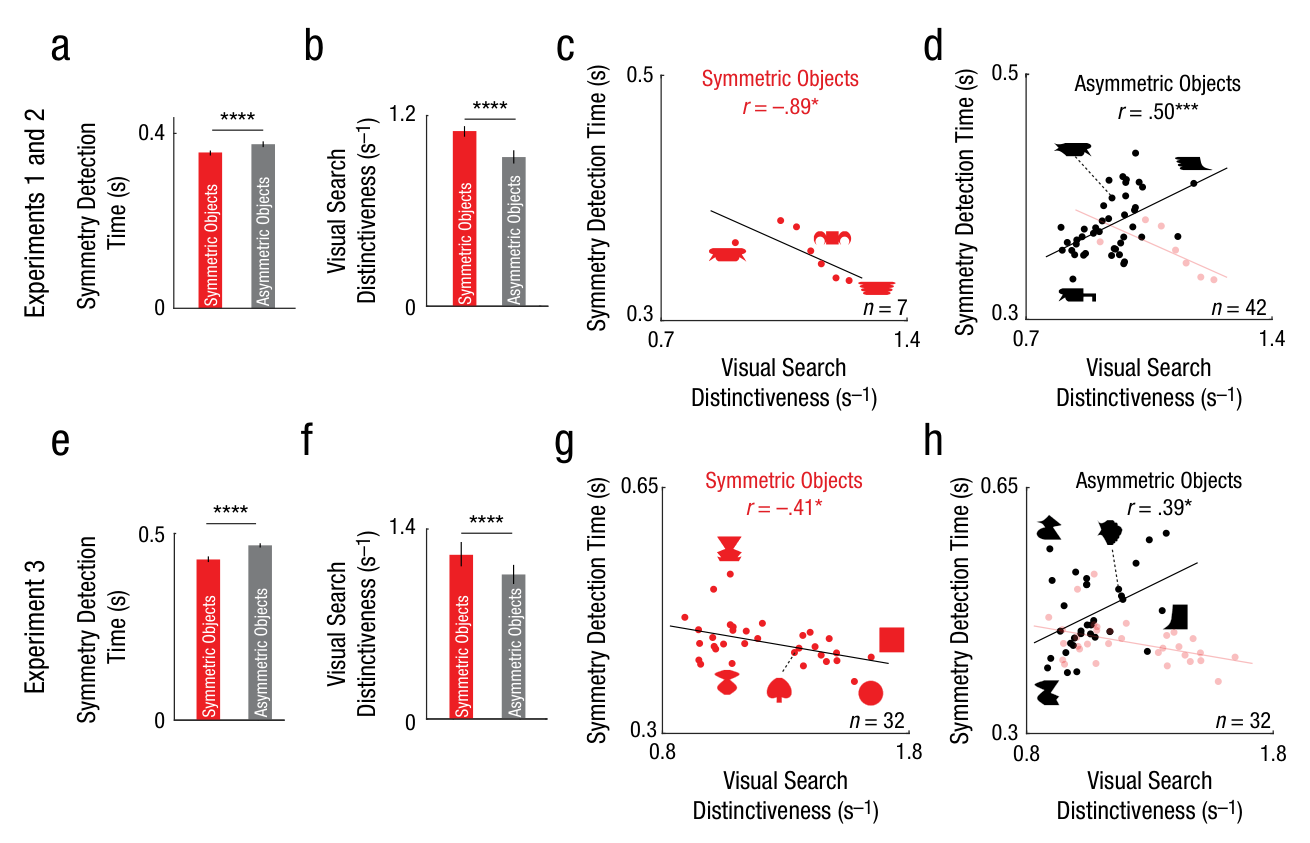
支持图注所述: Fig. 5. Distinctiveness as a predictor of symmetry perception in Experiments 1 through 3. Average response time during ...
verified
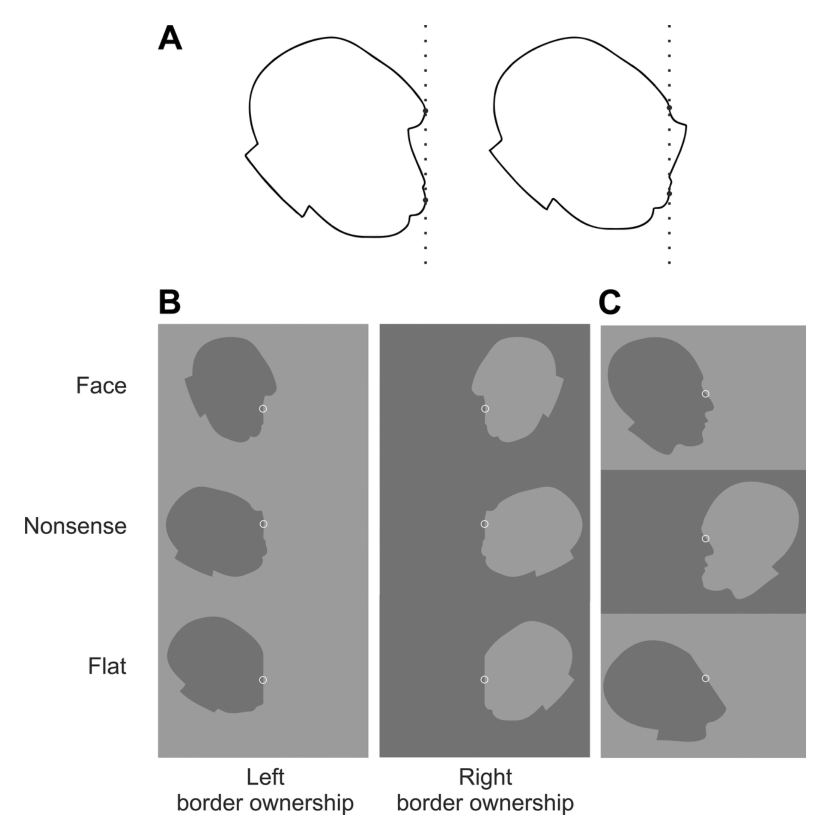
支持图注所述: Fig. 1. Construction of the face silhouettes and related
meaningless shapes used as stimuli in this study. A: for each
o...
verified
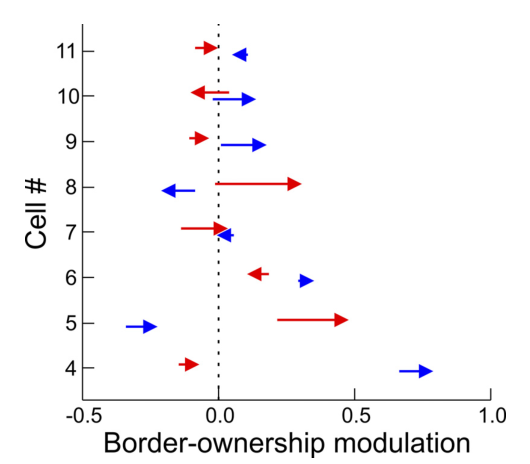
支持图注所述: Fig. 10. Test for a late influence of Facehood. The interaction Face-
hood Border ownership was determined for the earl...
verified
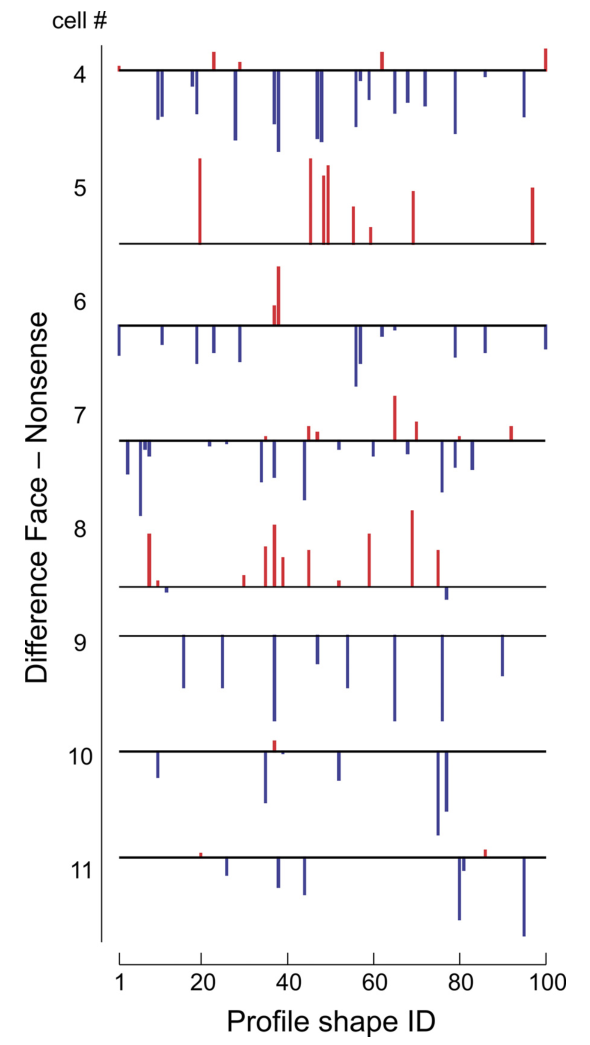
支持图注所述: Fig. 11. Consistency of the Face/Nonsense discrimination. The numbered bar
plots correspond to the 8 cells in which the ...
verified
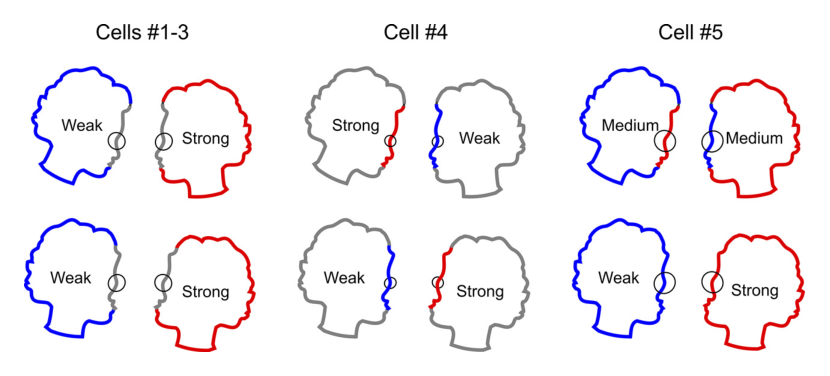
支持图注所述: Fig. 12. Schematic summary of the results illustrated in
Figs. 8 and 9. The contours of the Face (top) and Nonsense
(bot...
verified
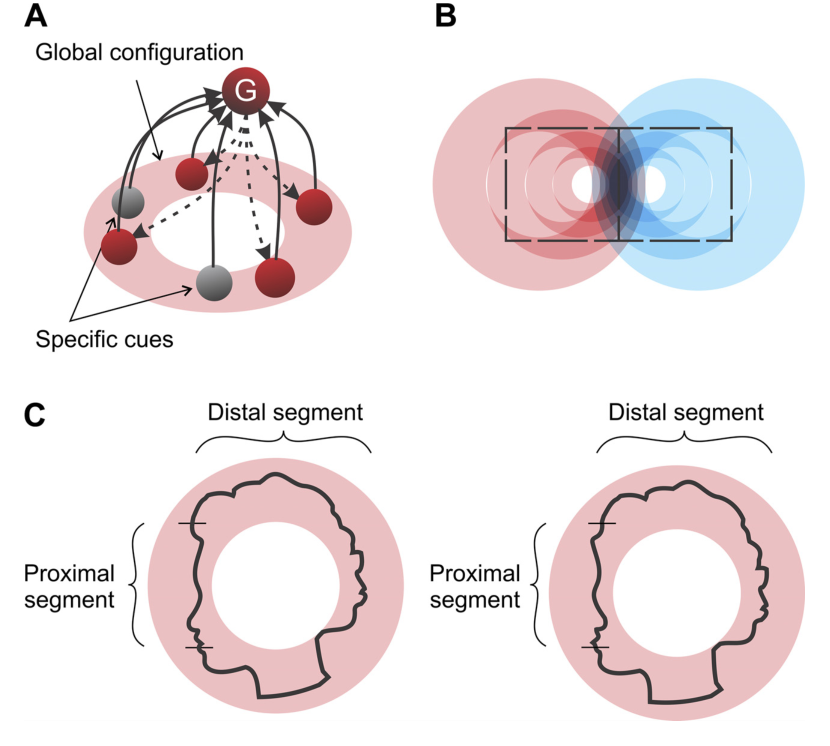
支持图注所述: Fig. 13. Toward an explanation of the Face/Nonsense dif-
ferentiation in border-ownership signals. Neurophysiologi-
cal ...
verified
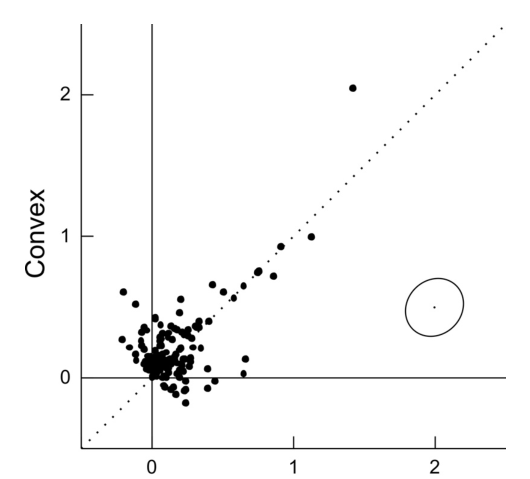
支持图注所述: Fig. 14. Comparison of the border-ownership signals for silhouettes with
convex and concave local curvature. Each dot re...
verified
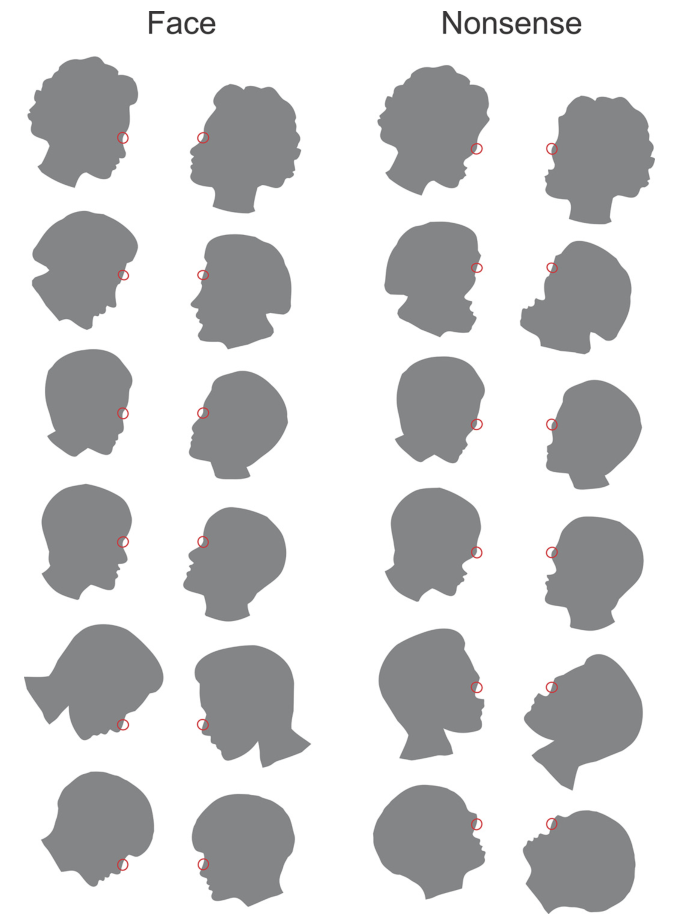
支持图注所述: Fig. 2. Illustration of 6 families of Face and Nonsense stimuli. Red circles
indicate placement of receptive fields; size...
verified
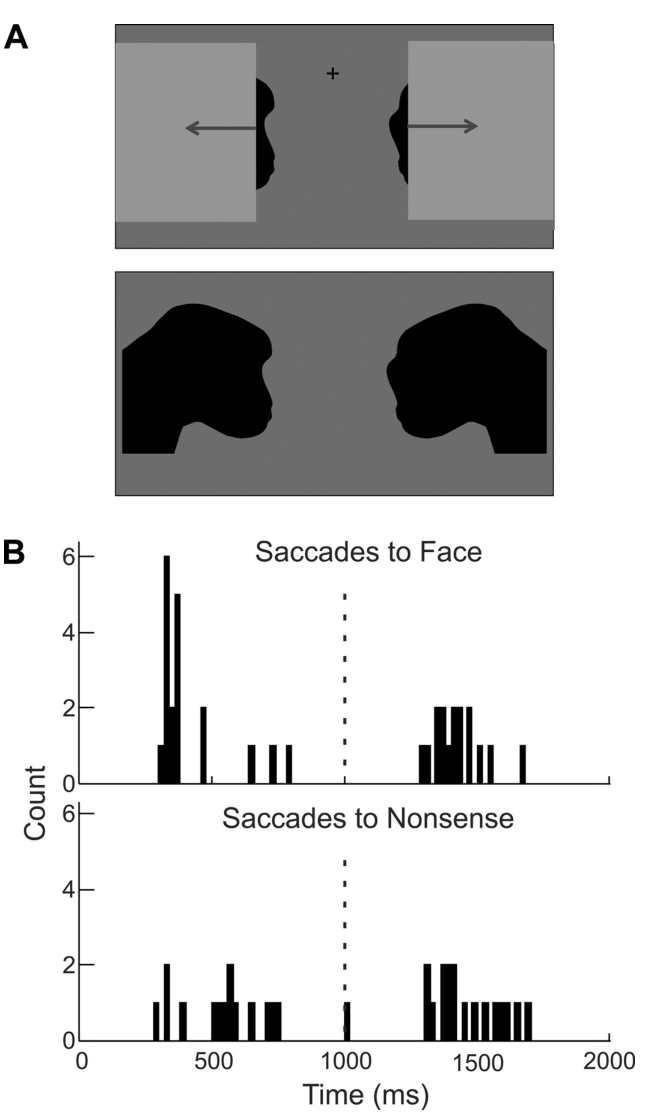
支持图注所述: Fig. 3. A “surprise test” was used to check if monkeys spontaneously perceive
Face and Nonsense silhouettes as different...
verified
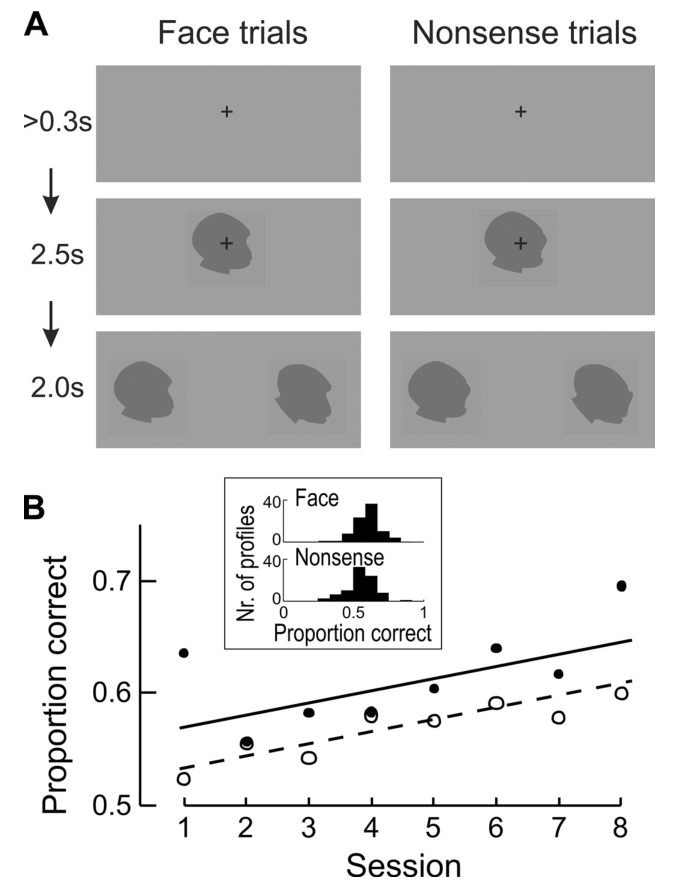
支持图注所述: Fig. 4. Monkey performance in a 2-choice match-to-sample task. A: during
periods of fixation, a sample Face (or Nonsense)...
verified
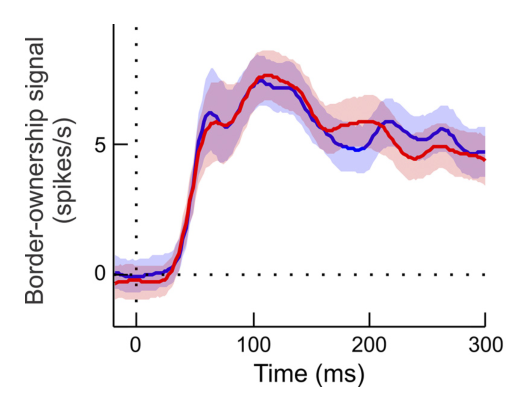
支持图注所述: Fig. 5. The time course of border-ownership signals for Face silhouettes (red)
and Nonsense shapes (blue). The curves sh...
verified
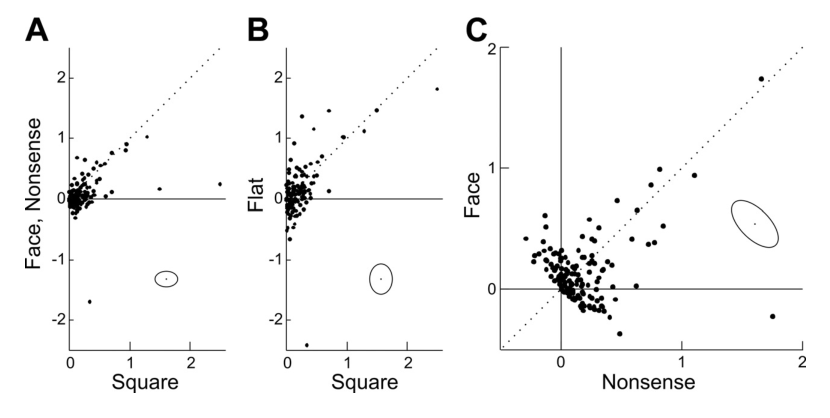
支持图注所述: Fig. 6. Comparison of the border-ownership signals for 4
different classes of shapes. The border-ownership signals,
as d...
verified
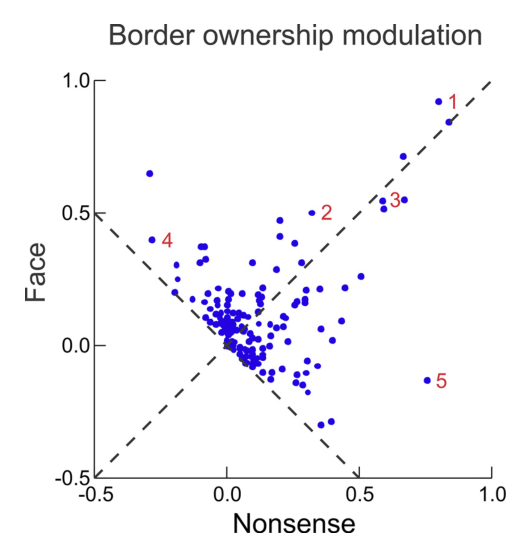
支持图注所述: Fig. 7. Border-ownership modulation of the responses to Face and Nonsense
shapes. Data are replotted from Fig. 6C but sh...
verified
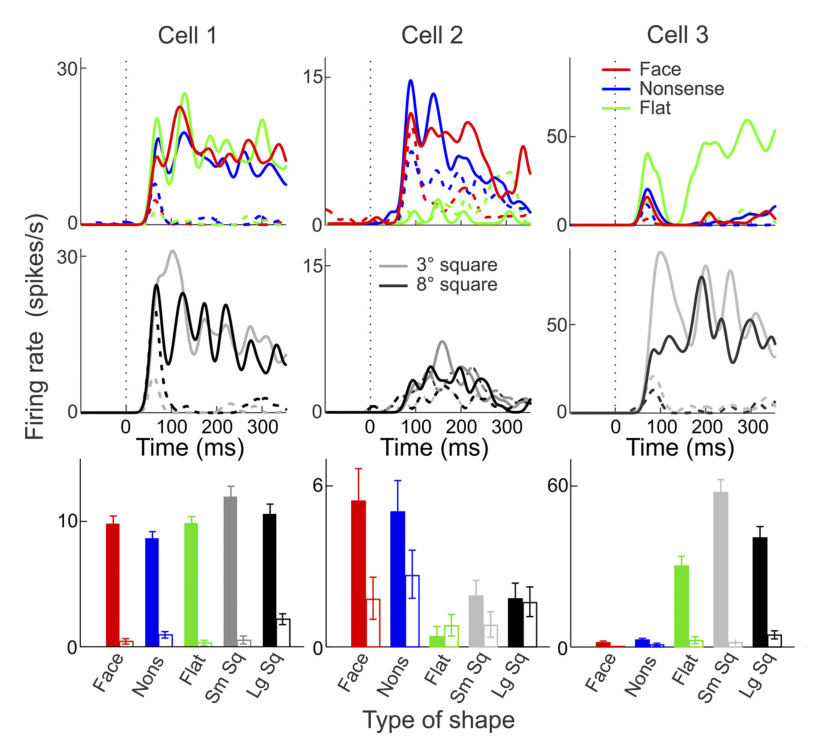
支持图注所述: Fig. 8. Time course and strength of responses of 3 neurons
(cells 1–3) with similar responses to Face and Nonsense
shape...
verified
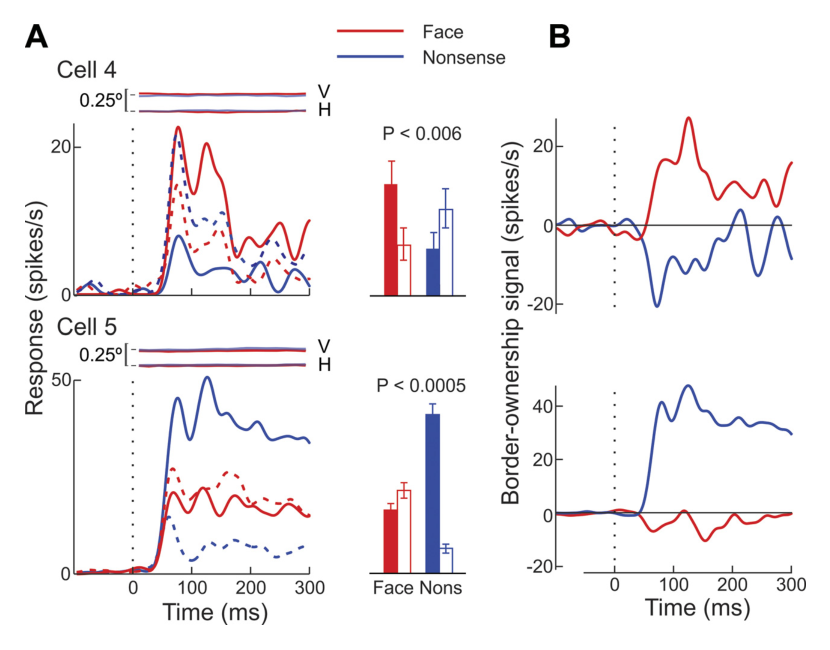
支持图注所述: Fig. 9. Time course and strength of responses of 2 neurons
(cells 4 and 5) with different responses for Face and
Nonsens...
verified
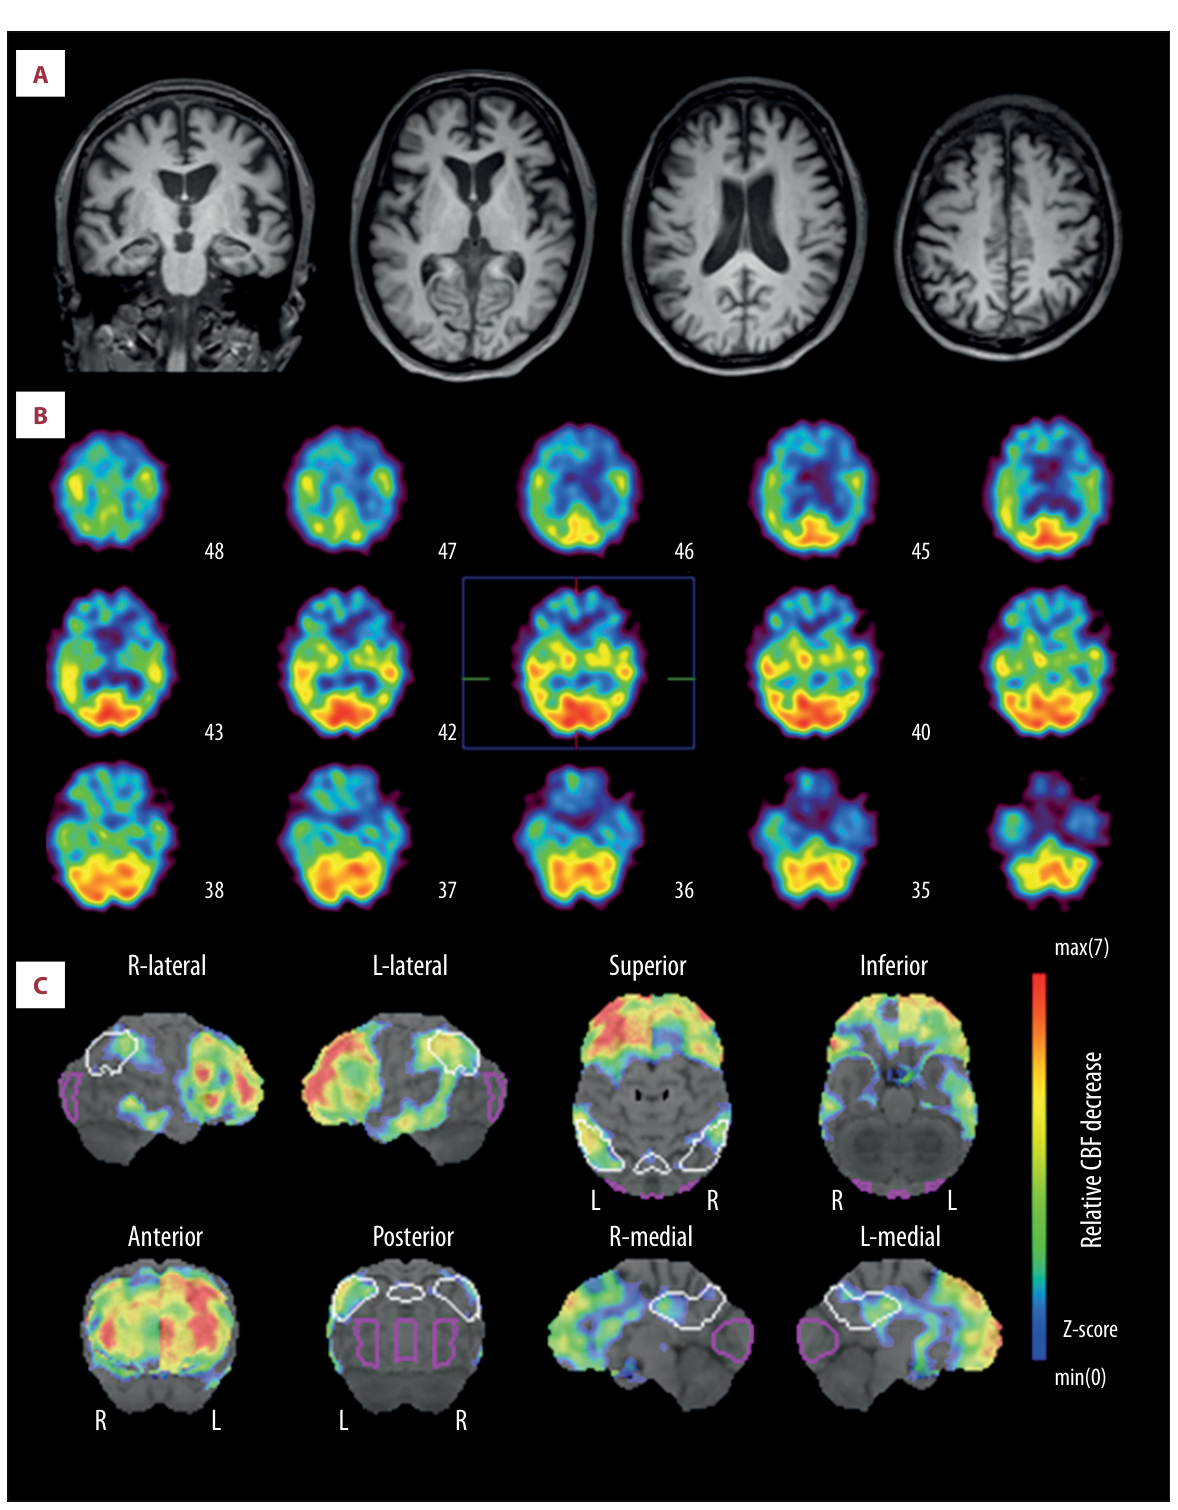
支持图注所述: Figure 1. (A) Brain MRI and (B) IMP-SPECT with (C) 3D-SSP analysis. Note that AD-like hypo-perfusion areas (posterior c...
verified
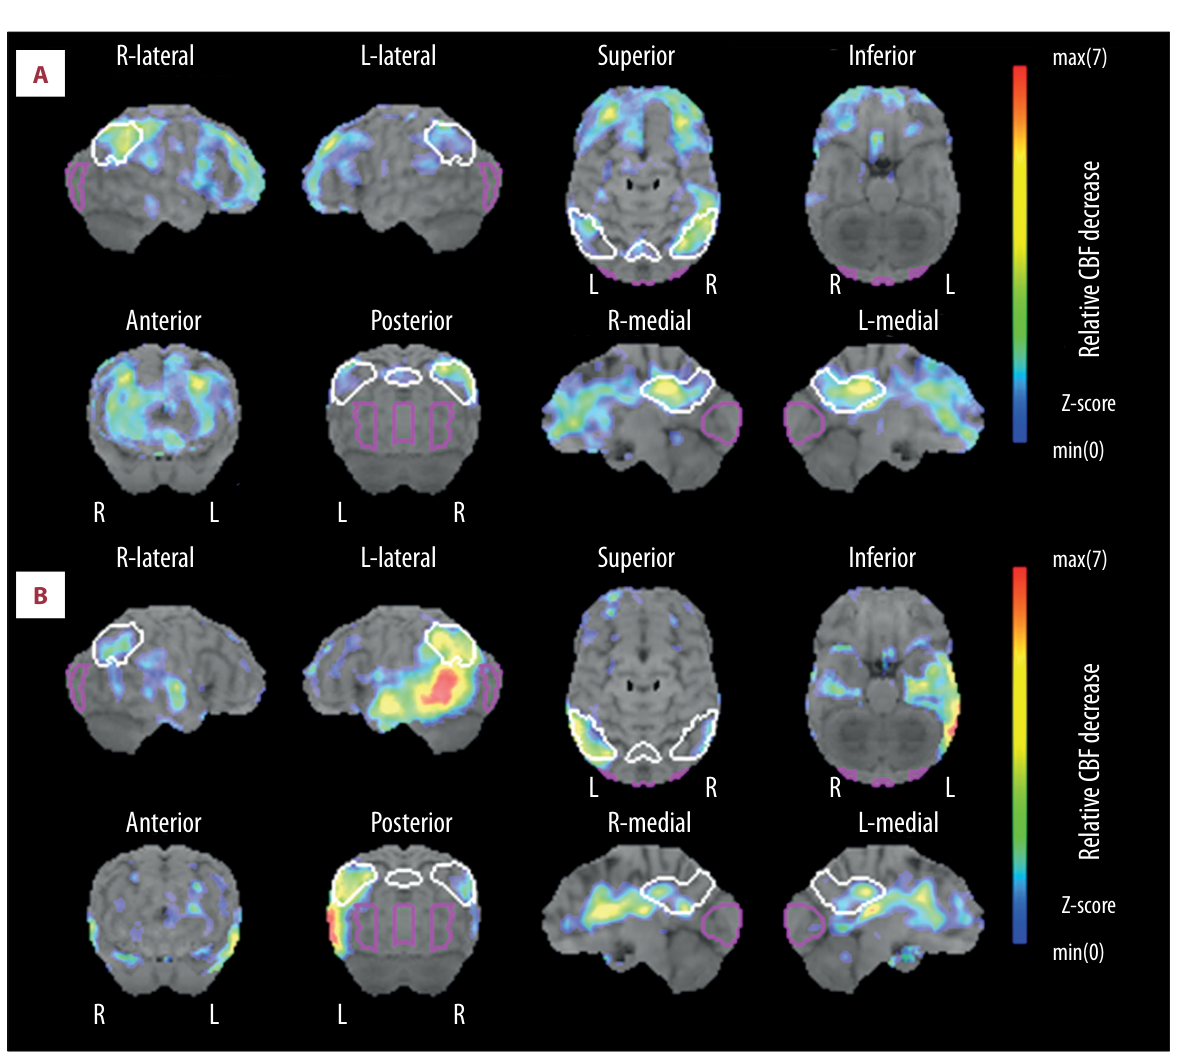
支持图注所述: Figure 2. Representative 3D-SSP statistical images of AD-like SPECT patterns in (A) early AD in a 69-year-old female; a...
verified
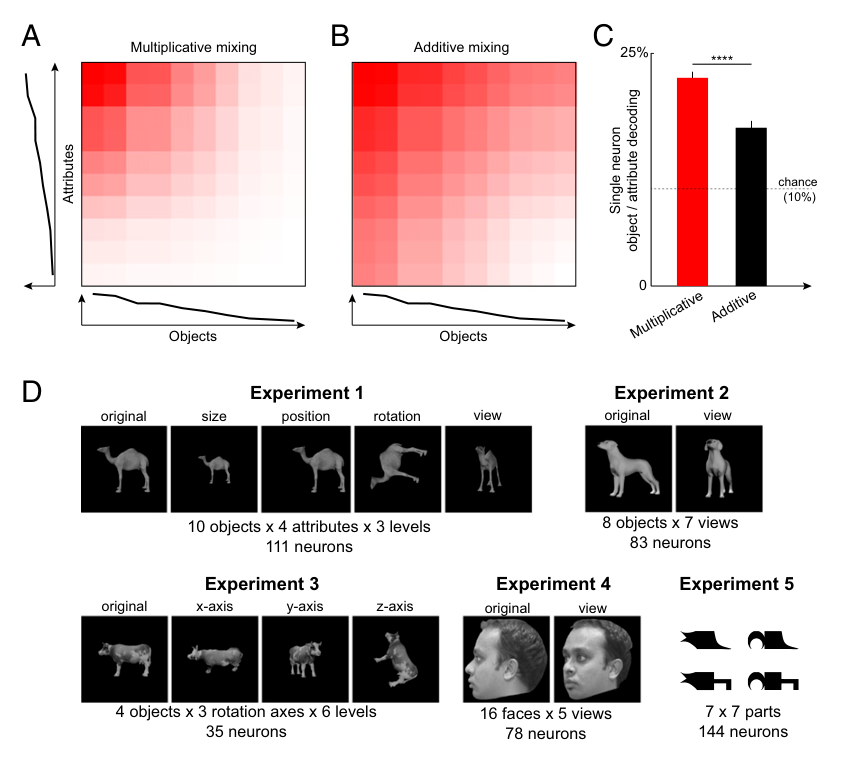
支持图注所述: Fig. 1.
Multiplicative vs. additive mixing. (A) Re-
sponse of a simulated neuron with identical tuning
for objects and a...
verified
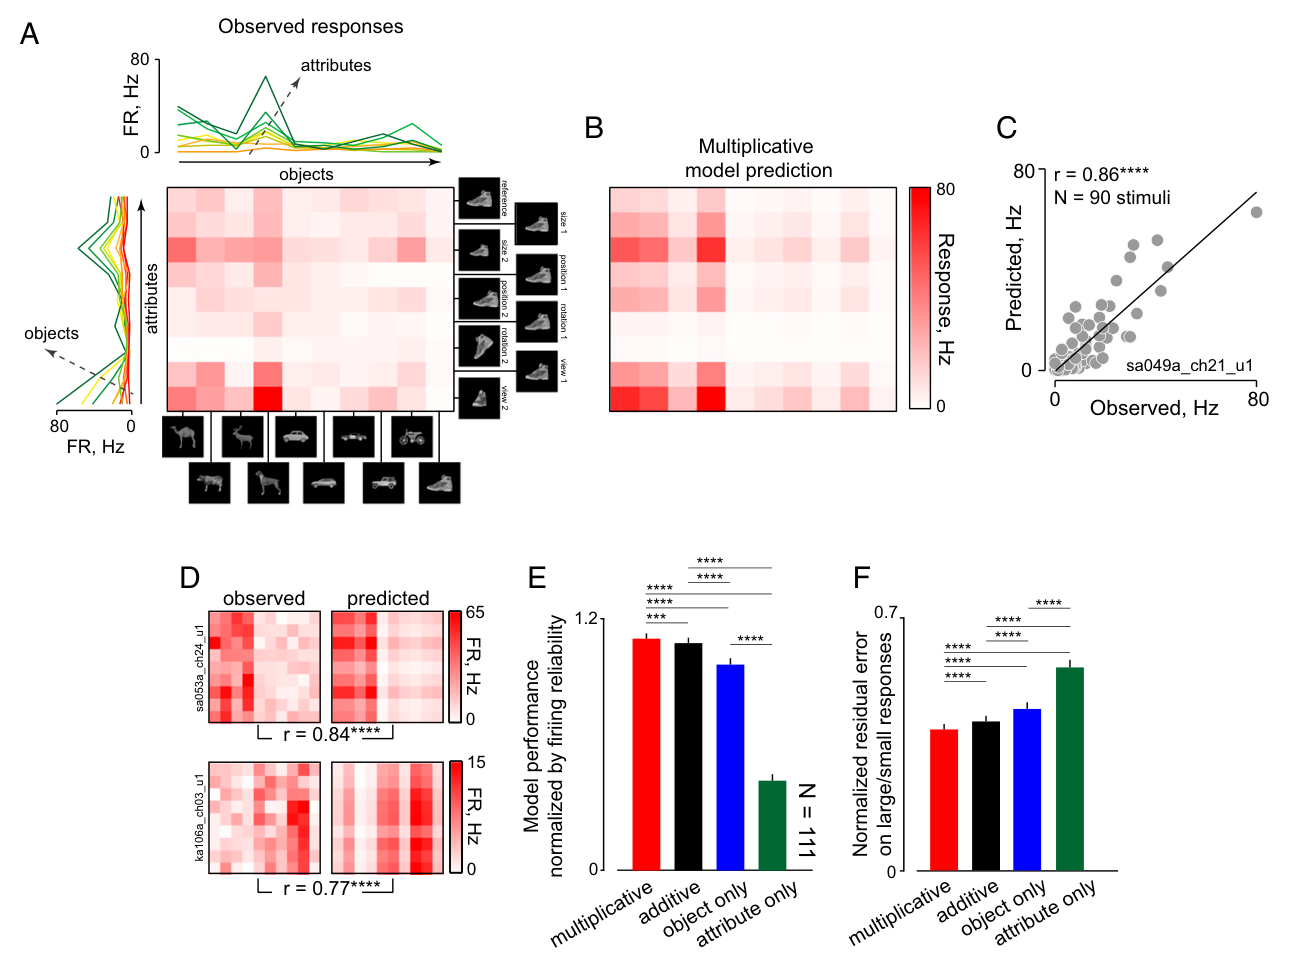
支持图注所述: Fig. 2.
Objects across many attributes (experiment 1). (A, Lower Right) Observed responses for an example IT neuron acro...
verified
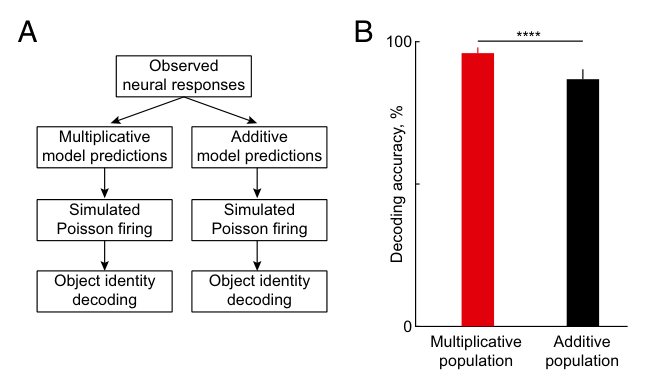
支持图注所述: Fig. 3.
Decoding with multiplicative and additive neurons. (A) Although
multiplicative and additive model performance wa...
verified
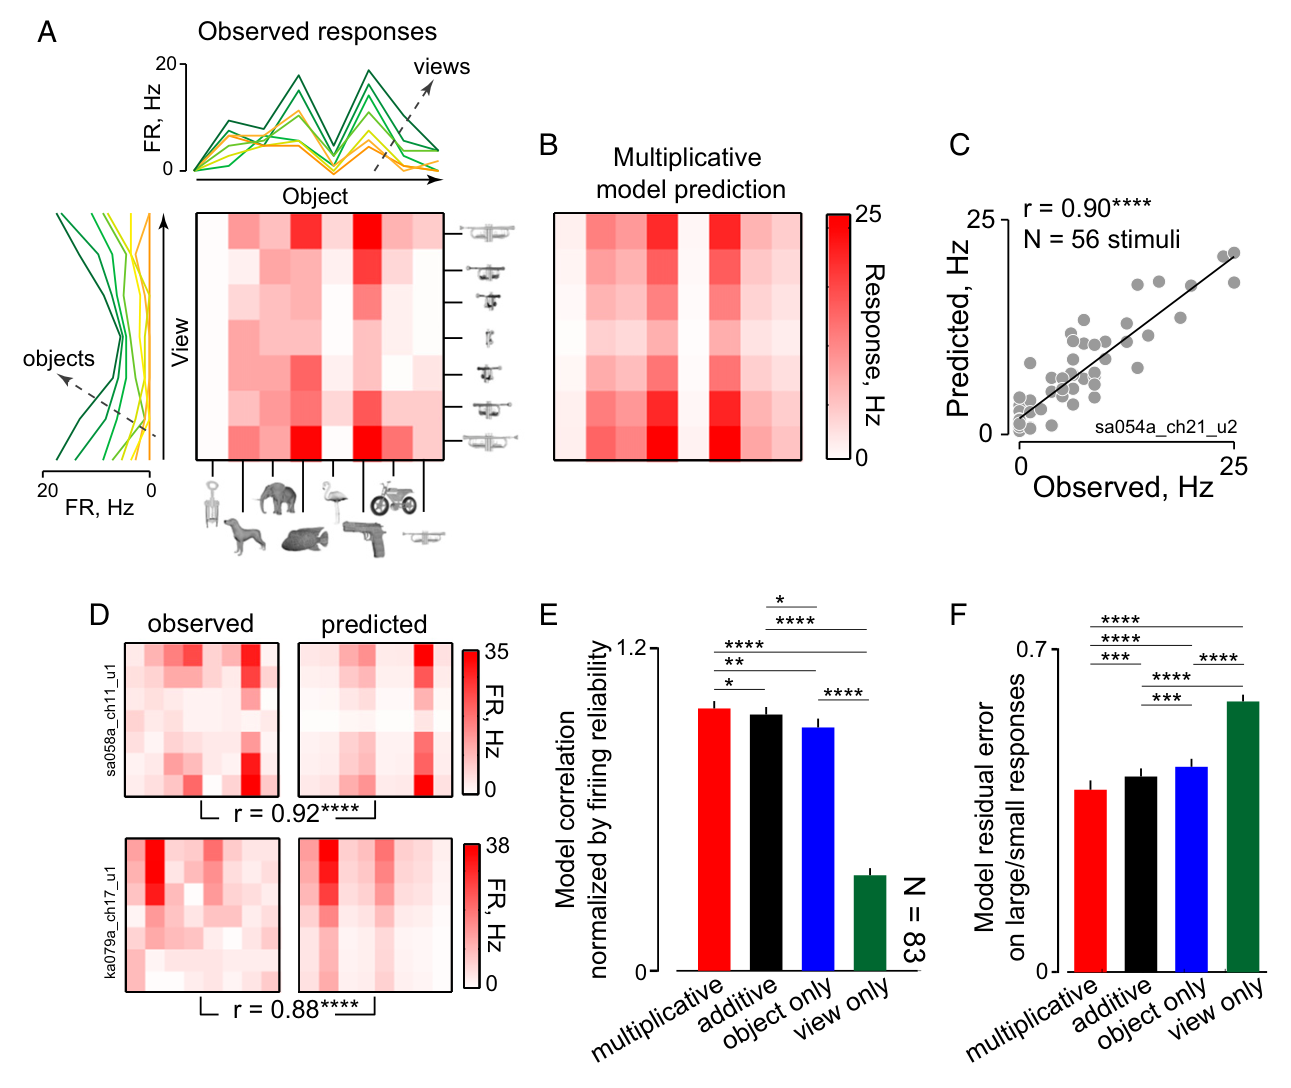
支持图注所述: Fig. 4.
Objects across rotations in depth (experiment 2). (A) Observed responses for an example IT neuron for a set of o...
verified
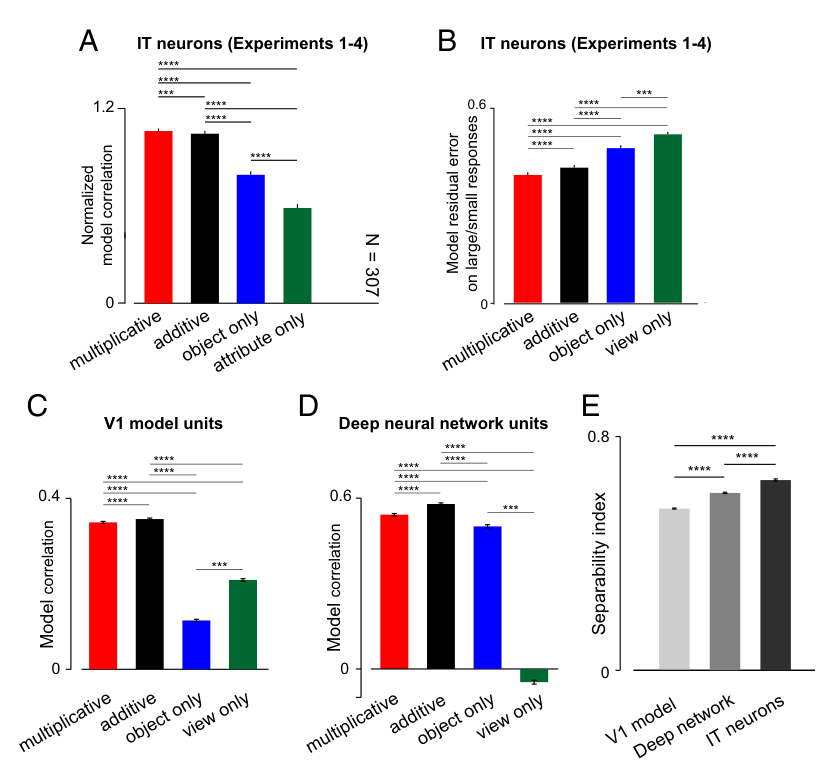
支持图注所述: Fig. 5.
Separability in IT neurons and computational
models (experiments 1–4). (A) Normalized model
correlation for the ...
verified
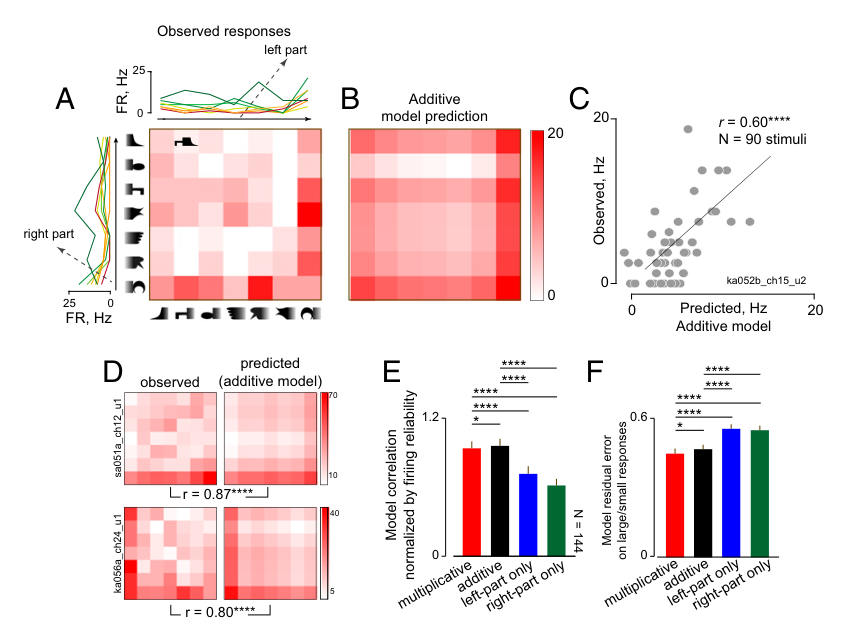
支持图注所述: Fig. 6.
Objects with varying parts (experiment 5). (A) Observed responses for an example IT neuron for a set of objects ...
verified
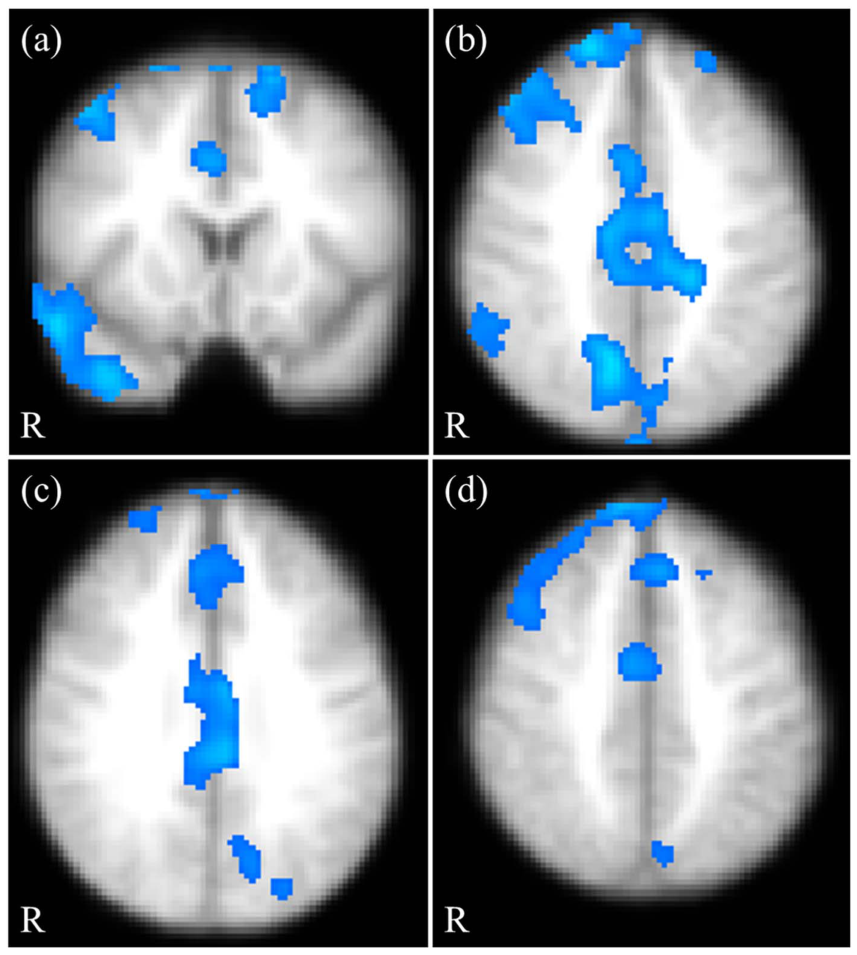
支持图注所述: Fig. 1. Brain regions that showed negative correlations be-
tween pre- intervention Food Craving Inventory subscales
and...
verified
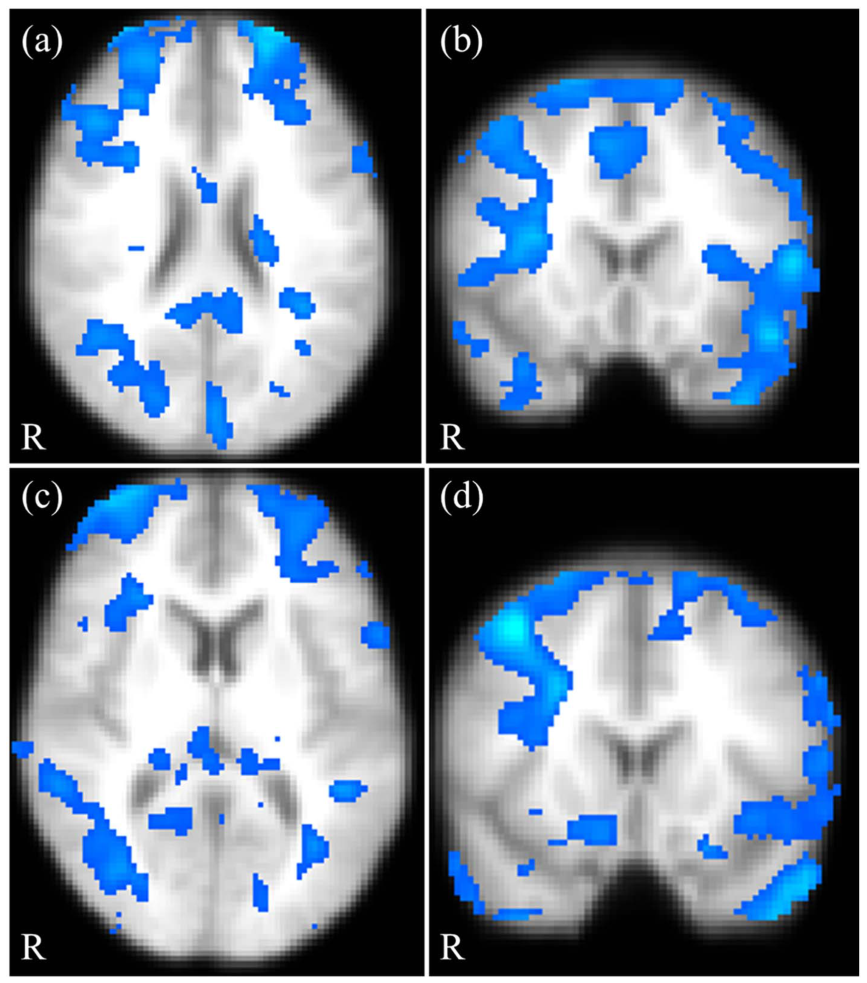
支持图注所述: Fig. 2. Brain regions that showed negative correlations
between post- vs. pre-intervention changes in Food Craving
Inven...
verified
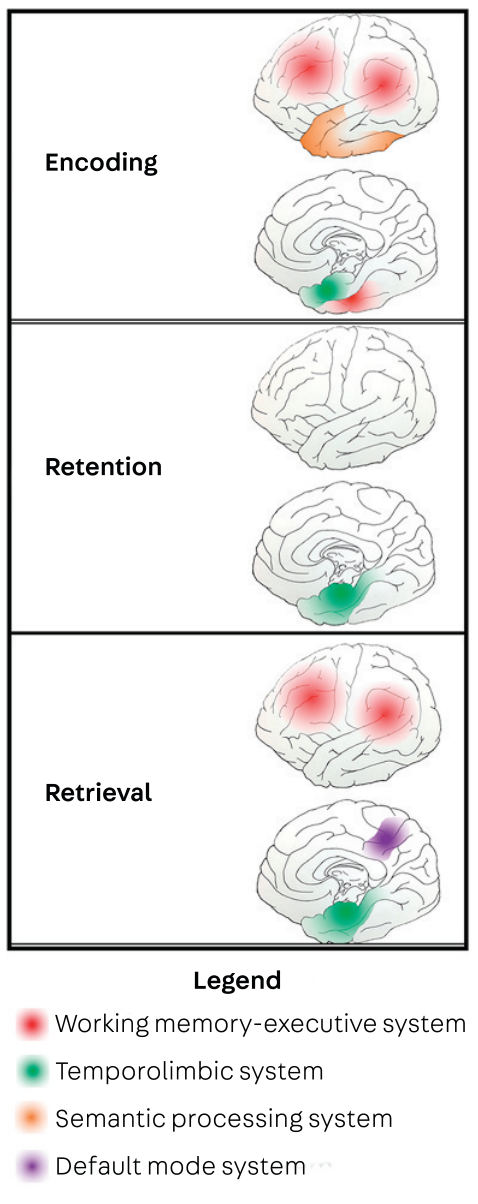
支持图注所述: FIGURE 3-1
Systems involved in episodic memory formation.
Original drawing by Jennifer Ann Ross....
verified