IT Literature Intelligence 终审版本 (VERIFIED) 论文编号:
164| 原始基线:V0_ZCODE_BASELINE| 语义审核:pass| 图表审核:passAstra裁决:compromise_revision(revise)
Simple Learned Weighted Sums of Inferior Temporal Neuronal Firing Rates Accurately Predict Human Core Object Recognition Performance
Majaj · The Journal of Neuroscience · 2015 · Zotero itemID=1571
这篇文章问的是一个"终极检验"级别的问题:能否找到单一、定量的联接假设(linking hypothesis,即把神经活动换算成行为的规则),在 64 项物体识别测试上同时复现人类成绩的模式与水平。作者用 5760 张光追渲染图像测了 104 名人类被试,又在两只猕猴的 V4 与 IT 皮层用多电极阵列记录了对同样图像的群体响应,然后系统枚举了 944 类候选联接假设。结论惊人地干净:只需把散布在 IT 各处的平均放电率做学习得到的加权和(LaWS of RAD IT),就能精确预测人类行为,而像素、V1 样模型、V4 乃至更精细的 IT 时间码与模块化方案全部失败或无增益。
研究背景
损伤研究与大量电生理工作早已把视知觉物体识别的舞台定位于腹侧通路(ventral stream,V1–V2–V4–IT)。此前的证据显示,IT 在识别任务上优于早期表征(Hung et al., 2005;Rust and DiCarlo, 2010),且 IT 神经元活动与知觉报告部分相关(Sheinberg and Logothetis, 1997;Kriegeskorte et al., 2008)。但作者指出,这些工作要么只在个别任务上做定性比较,要么用单任务的绝对正确率作指标——而绝对水平会被神经元数量、噪声等参数强烈调制,难以判定"哪个脑区、哪种神经码"真正承载行为。当时缺少的,是一个能在宽任务范围上被定量证伪的联接假设。
研究对象被限定为"核心物体识别"(core object recognition):图像单次注视呈现 100 ms、位于视野中央 10° 以内。要回答上述问题,需要三样东西同时到位:足够苛刻且覆盖人类能力范围的行为测验、对同一批图像的充分神经采样、以及把"神经码 + 下游解码器"具体化为可计算命题的框架。此前没有任何研究把三者拼在一起,这就是本文要填的缺口。
研究思路
作者的总体策略等于一场图灵测试式的比对:让每一个候选联接假设"假装是被试",在同样 64 项测试上给出预测成绩(d'),再与人类实测 d' 的整体模式对表。逻辑上这是四步走:(1)设计严格的行为基准;(2)对同一图像集获得充分的神经元采样;(3)把文献中流传的各类联接思想实例化为具体的编码—解码方案;(4)用交叉验证的预测与真实行为对表。关键的方法论洞见是:绝对成绩对神经元数量极其敏感,而"跨 64 项测试的成绩模式"才是稳健的量尺——好假设必须既匹配模式(consistency),又匹配幅度(performance)。
这一设计天然具备证伪性:不同假设预测出不同的 d' 模式,故不可能全对;也存在"全部失败"的可能(比如神经元采样不足,或猴与人类行为模式根本不同)。作者事先定义了两个度量——一致性(consistency,64 项测试上预测 d' 与人类 d' 的 Spearman 秩相关)与相对成绩(performance,预测 d' 与人类 d' 之比的中位数)——并以"一个个体的成绩与群体池化成绩的相关"(human-to-human consistency)作为及格线。
方法
行为方面,作者从 8 个基本层类(basic-level:动物、船、车、椅、脸、水果、飞机、桌)各取 8 个实例,构成 64 个 3D 模型,用 POV 光追软件写实渲染,用 POV 光追软件写实渲染:低变化集将各物体固定在图像中央,采用固定视角和尺寸,仅更换背景(每物体 10 张,共 640 张);中、高变化集同时随机化六个观察参数(水平/垂直位置、尺寸、绕三轴旋转),并随机更换背景(各 2560 张)。三个变化水平合计 5760 张 256×256 的无彩色图像。(水平位置 ±1.2°/±2.4°、垂直 ±2.4°/±4.8°,三轴旋转 ±45°/±90°,尺寸 ×[1/1.3, 1.3] 与 ×[1/1.6, 1.6],分别为中/高变化),每张不含重复背景。人类被试(104 人,经 Amazon Mechanical Turk,实验室复核相关 0.94)做 8 选 1 匹配:注视 500 ms → 中央 8° 图像呈现 100 ms → 300 ms 延迟 → 点击八张响应图之一,无反馈。从池化混淆矩阵按信号检测论计算每个二分类任务的 d'(d' = Z(TPR) − Z(FPR));3 个任务集 × 8 目标 × 3 变化水平本可得 72 个 d',剔除高变化下面孔辨识(处于随机水平)的 8 个后得 64 项测试。
神经记录方面,两只雄性恒河猴(7 与 9 kg)左半球各植入三个 10×10 Blackrock 微电极阵列(V4 一个、IT 两个),共 296 个视觉驱动位点(IT 168 个:PIT 76、CIT 75、AIT 17;V4 128 个)。每张图像至少重复 28 次(典型约 50 次),以 RSVP 方式呈现(100 ms 图像 + 100 ms 灰屏),每只猴累计采集约 68/65 天;多数分析基于多单位活动(MUA)。响应定义为 70–170 ms 窗口内放电数减去基线、再除以该位点当日响应的标准差。下游解码器用生物学上说得通的线性分类器:SVM(LibSVM,L2 正则)与相关解码器(CC,基于类中心的相关读出),按"一对其余"训练 8 个解码器、取输出裕量最大者为"行为选择",至少 50 次训练/测试划分。对照组包括像素、V1 样 Gabor 模型、PHOG、SIFT、HMAX 变体 SLF、L3 等计算机视觉特征。判据:一致性越过的灰色带是 human-to-human consistency(中位 0.929,68% CI [0.882, 0.957]);performance 需接近 1。
主要结果
-
人类核心识别能力的定量画像(图 3):64 项测试的 d' 覆盖极大范围——基本层分类平均 d' 3.46,车辆细节辨识 1.49,面孔细节辨识仅 0.50;随变化水平升高 d' 从 2.39(低)经 1.89(中)降至 1.50(高)。这说明人类并非完全不变式(invariant),且容忍度与形状相似性交互:任务越细节化,视角变化越致命。个体与群体模式的 Spearman 相关中位数 0.93,排除被试差异解释。
-
简单的 IT 放电率加权和精确命中人类行为(图 4、5、7):以 128 个 IT 位点、70–170 ms 平均放电率、SVM 解码的 LaWS of RAD IT 假设,其 64 项预测 d' 的模式与人类实测在统计上不可区分,一致性落入 human-to-human 灰色带;位点数达到约 100 之后一致性即封顶。这是首个在全任务域上定量充分的行为—神经联接展示。
-
低、中层次编码与所有 V4 假设全军覆没(图 5、6、7):像素、V1 样、PHOG、SIFT、SLF、L3 及全部 V4 假设的一致性均远低于及格线,且加神经元、换解码器都救不回来。V4 的失败方式颇有信息量:它在部分低变化测试上超过人类、在高变化测试上不及人类——模式错位,不是采样不足。在物体位置固定于注视中心的 32 项测试中,采用各含 58 个位点的相关解码器,V4 与人类行为的一致性为 −0.196(CI [−0.358, 0.001]),IT 为 0.868,human-to-human 一致性中位数为 0.887。另一项仅取对侧视野图像的分析中,V4 一致性为 0.470 ± 0.111。这两项控制分析支持:所测 V4 联接假设与人类行为模式的不匹配不能仅归因于感受野大小或视野覆盖限制。
-
更精巧的 IT 编码没有增益(图 5c–e):显式保留试次间相关结构(simultaneous)与打乱(shuffled)无差别;把 100 ms 窗拆细到 10×10 ms 的时间码也无改变;把"面孔贴片"(face patches)强模块化(面孔任务只读面孔区)不仅不提升,趋势反而略降。值得注意的细节是:面孔检测任务的解码器权重 Top 5% 中 87.5% 是贴片样位点(与弱模块化一致),而面孔辨识任务中这个比例只有 12.5%。
-
所需神经元数量的推算(图 7b、8、10):拟合给出约 529 个试次平均 IT 位点(V4 则需约 22,096 个)可匹配人类绝对水平;单单位(SUA)约需 MUA 的两倍、单试次读出约需试次平均的 60 倍,折算出约 6 万个分布式 IT 单神经元即可同时命中模式与幅度,且每个物体只需约 40 张训练图像(68% CI [30, 60])就能从头学会一个任务——这远少于 IT 向下游投射的约一千万个神经元。时间窗方面,一致性在窗口中心约 100 ms 处进入平台并维持约 100 ms(图 7c, d)。
图注解读
图 1 · 任务设计与四种可能结局
原文图注:Figure 1. a, Object recognition tasks. To explore a natural distribution of shape similarity, we started with eight basic-level object categories and picked eight exemplars per category resulting in a database of 64 3D object models. To explore identity preserving image variation, we used ray-tracing algorithms to render 2D images of the 3D models while varying position, size, and pose concomitantly. In each image, six parameters (horizontal and vertical position, size, rotation around the three cardinal axes) were randomly picked from predetermined ranges (see Materials and Methods).Theobjectwasthenaddedtoarandomlychosenbackground.Alltestimageswereachromatic.Humanobserversperformedalltasksusingan8-wayapproach(i.e.,seeoneimage,chooseamongeight;seeMaterialsandMethods).Twokindsofobjectrecog... b, Possible outcomes for each tested linking hypothesis. We defined multiple candidate neuronal and computational linking hypotheses (Fig. 5), determined the predicted (i.e., cross-validated) object recognition accuracy (d') of each linking hypothesis on the same 64 tests (y-axis in each scatter plot), and compared those results with the measured human d' (x-axis in each scatter plot). A priori,eachtestedlinkinghypothesiscouldproduceatleastfourpossibletypesofoutcomes.Thepatternofpredicted d' might be unrelated to or strongly related to human d' (left vs right scatter plots). We quantified that by computing consistency, the correlation between predicted d' and actual human d' across all 64 object recognition tests. Average predicted d' might be low or matched to human d' (bottom vs top scatter plots). We quantified performance by computing the median ratio of predicted d' and actual human d', across all 64 object recognition tests...
这张图是全文的概念地图:a 列出 64 个 3D 模型、参数化渲染与 8 选 1 任务,指出每套 8-way 块内含 8 个二分类任务、共得 64 个 d';b 用四张示意散点图定义了判定矩阵——预测模式与人类模式可以相关或不相关(consistency 高/低),平均水平可以偏低或对齐(performance 低/高),右上角"高分且高一致"才是"充分"假设。读懂这张图,后面所有Scatter comparisons都只是在往这个 2×2 里填点。它支撑背景部分对"联接假设必须可证伪"的立论。
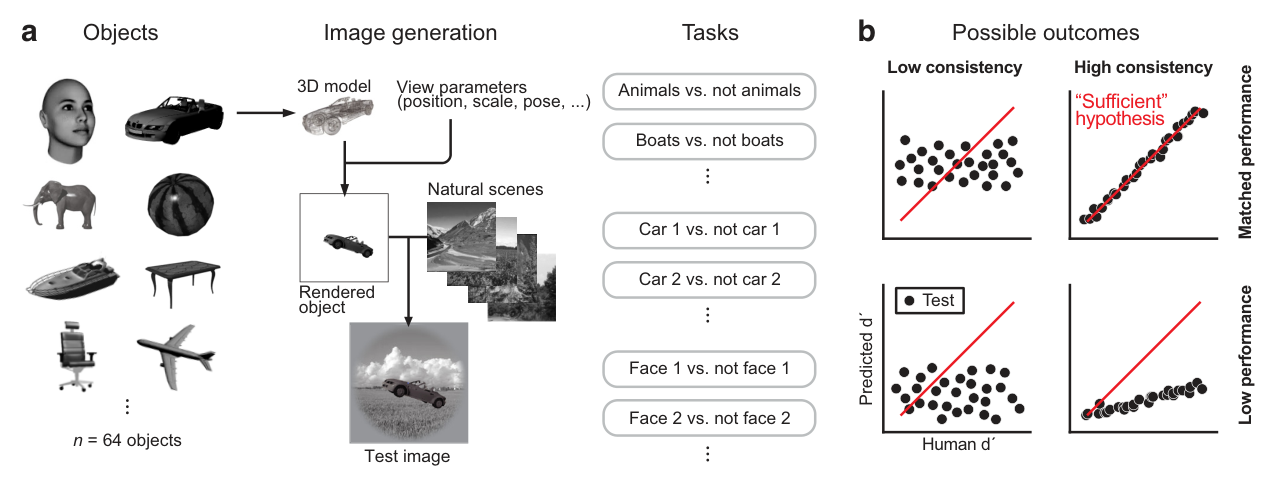
图 2 · 神经记录布局与响应矩阵
原文图注:Figure 2. a, We used multielectrode arrays to record neural activity from two stages of the ventral visual stream [V4 and IT (PIT, CIT, AIT)] of alert rhesus macaque monkeys. We recorded neural responses to the same images used in our human psychophysical testing. Each image was presented multiple times (typically ~50 repeats, minimum 28) using standard rapid visual stimulus presentation (RSVP). Each stimulus was presented for 100 ms (black horizontal bar) with 100 ms of neutral gray background interleaved between images. Although some of our neural sites represented single neurons, the majority of our responses were multiunit (see Fig. 8a). The rasters for repeated image presentations were then tallied within a defined time window (e.g., 70–170 ms after image onset, red rectangle, black vertical line indica... b, Approximate placement of the arrays in V4 (green shaded areas) and IT (blue shaded area) is illustrated by the black squares on two line drawings representing the brains of our two subjects.
a 面板示范了原始数据的形态:RSVP 流程、刺激时长与灰屏间隔、如何把叠加光栅图计入 70–170 ms 窗口得到每图每点的平均放电率(绿色响应向量),以及全部 5760 张图像的向量如何拼成响应矩阵;b 给出两只动物 V4 与 IT 阵列的大致解剖位置。它交代了方法部分"响应矩阵 = 位点 × 图像"的来龙去脉,是理解所有后续解码分析的输入格式。
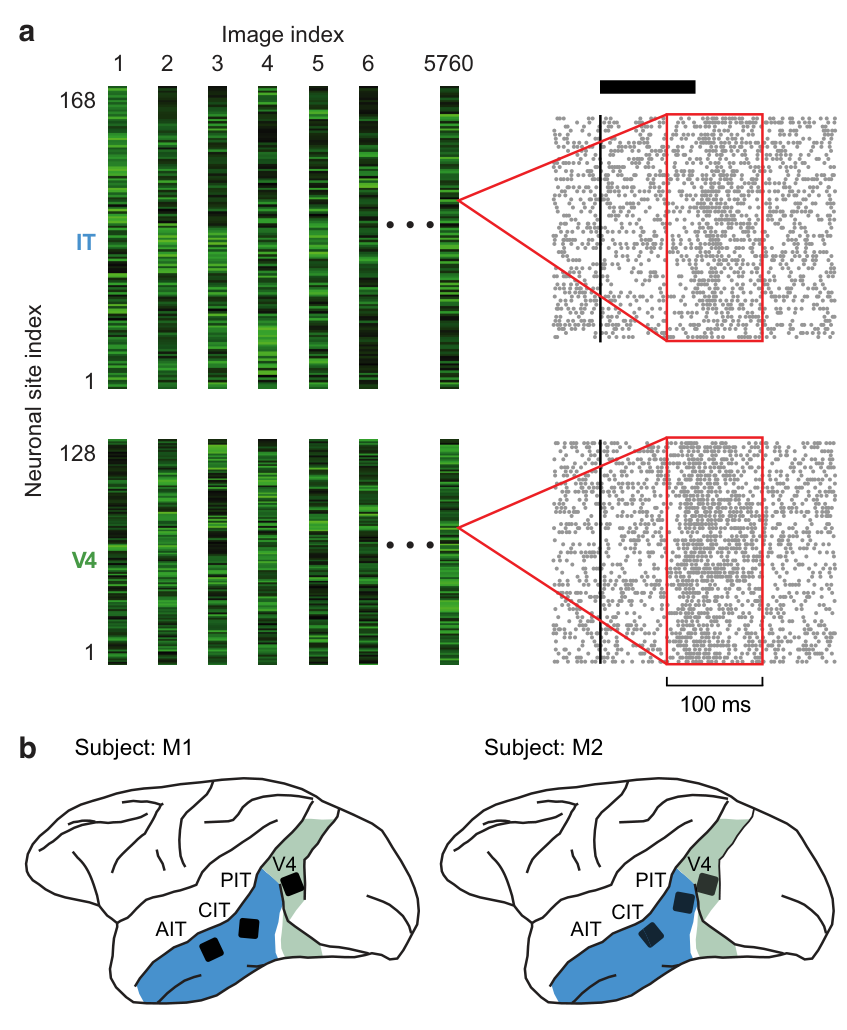
图 3 · 人类 64 项测试的成绩全景
原文图注:Figure 3. a, Each color matrix from left to right summarizes the pooled human d' for each of the three task sets ranging from basic level categorization to subordinate level face identification. In each matrix, the amount of identity preserving image variation was increased from low (bottom) to high (top), resulting in a total of 64 behavioral tests. Red represents high performance (d'=5) and blue low performance (d'=0). For each 8-way test set and each level of variation, the computed eight d's were based on the average confusion matrix of multiple observers (basic level categorization, n=29, car identification, n=39, face identification, n=40; see Materials and Methods for more information). b, Human to human consistency. The scattergram shows the performance (d') of one human observer plotted against the performance (d') of the pooled population of human obser...
a 是行为基准的主图:三块颜色矩阵(基本层分类 / 车辨识 / 脸辨识)× 三个变化水平,每格一个 d',自下而上越来越难——颜色总体由红转蓝,具体任务是读者的"考点分布图"。b 用"个体 vs 群体"散点给出人-人一致性(示例 Spearman 0.941,中位 0.929),这条虚线加灰色带就是后面所有假设必须跨越及格线。该图支撑结果第 1 条,也是全部可比性的来源。
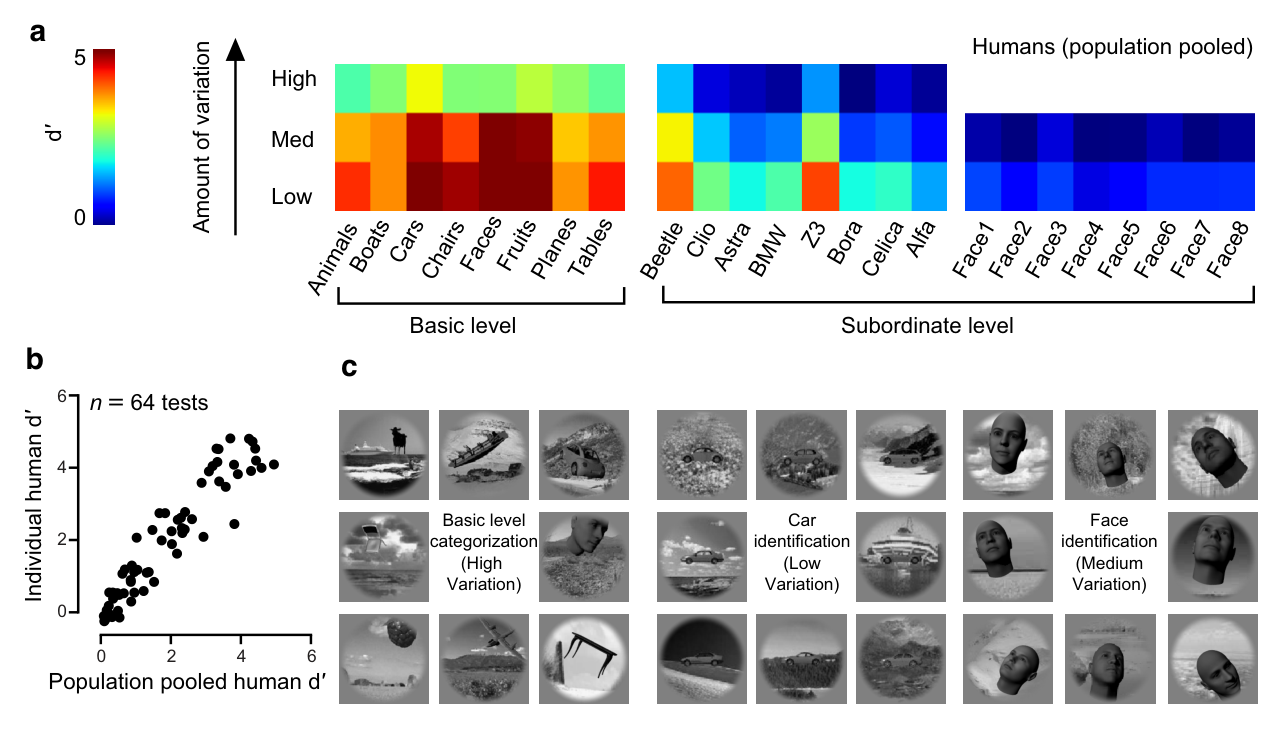
图 4 · 一个胜出假设的完整预测
原文图注:Figure 4. Predicted performance pattern of an example LaWS of RAD IT neuronal linking hypothesis. In this example, the hypothesized neural activity that underlies behavior is as follows: in IT, from 128 units, mean firing rate, in a time window of 70–170 ms; and the decoder is an SVM decoder. a, Based on the aforementioned features of neural activity, a depiction of the outputs of two example decoders for two tasks from two different task sets. For each task set (basic categorization, subordinate identification) and each variation level (low, medium, high), we randomly divided our image responses into "training" and "testing" samples. We used the "training" samples, depicted by the green response vectors, to optimize eight "one-vs-rest" linear decoders. The performance of each decoder was then evaluated on the "testing"... b, Predicted pattern of behavioral performance for all 64 behavioral tests... c, To facilitate comparison among different linking hypotheses and with human behavior (see Fig. 5), we strung out the color matrices into a color vector grouping task sets at each variation level.
a 用"脸2识别"与"脸/非脸"两个任务演示训练—测试流程与解码器输出分布;b 展示该假设在全部 64 项测试上的预测 d' 颜色矩阵,与图 3a 并排看几乎逐格吻合;c 把矩阵拉直成一条色带,为图 5 的逐条比较做准备。这张图是"主结果第 2 条"的直观呈现:同样的加权和规则,难度起伏模式与人类一模一样。
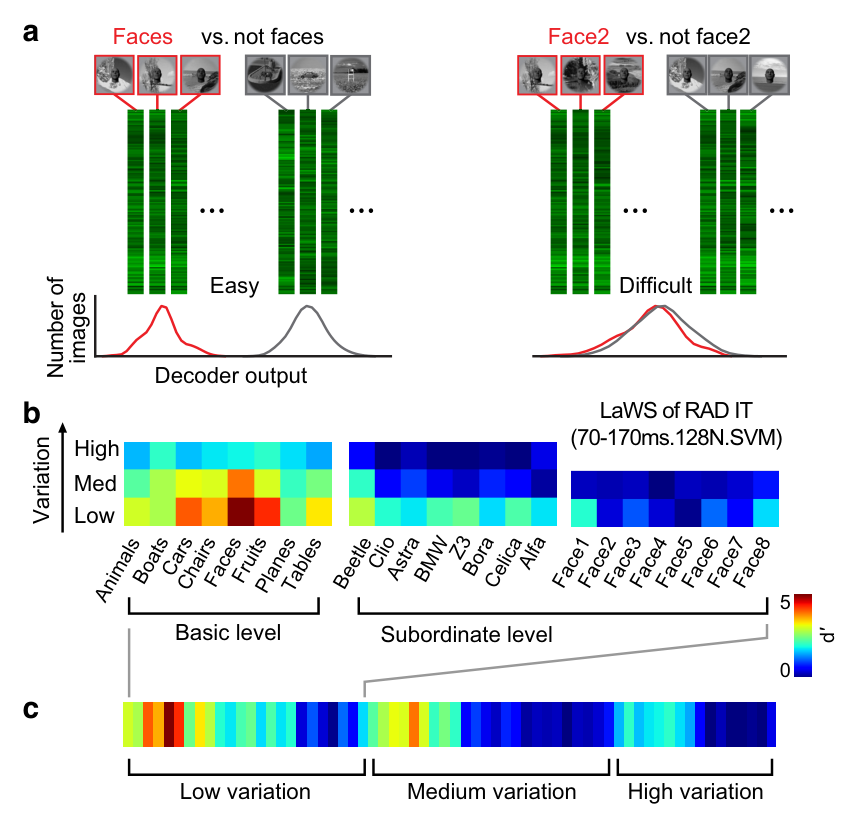
图 5 · 候选联接假设的横向对照
原文图注:Figure 5. a, Candidate linking hypotheses that we explored were drawn from a space defined by four key parameters: spatial location of sampled neural activity, the temporal window over which the response of our units was computed (mean rate in this window), the number of units, and the type of hypothesized downstream decoder. Each candidate linking hypothesis is a specific combination of these parameters. For example, in green is a V4-based linking hypothesis with a temporal window of 70–170 ms that includes 128 neural sites and uses an SVM decoder. The predicted performance of each linking hypothesis for each behavioral test is depicted as a color vector where blue signifies low predicted performance (d'=0) and red signifies high predicted performance (d'=5). The goodness of each linking hypothesis can be visually evaluated by comparing its color pattern with that of the hu... b, Consistency. To quantify the ability of each linking hypothesis to predict the pattern of human performance (i.e., the similarity between color vectors in a), we computed the Spearman rank correlation coefficient between predicted performance and actual (pooled human, 104 subjects) across all task d's. Median human-to-human correlation is indicated by the dashed line (median Spearman correlation coefficient of 0.929). The gray region signifies the range of human-to-human consistency (68% CI=[0.882,0.957]). Each bar represents a different candidate linking hypothesis... Within the context of IT-based linking hypothesis, we explored finer grain temporal codes (c). We also took advantage of our simultaneous multielectrode array recording to assess the impact of trial-by-trial firing rate correlation on the pattern of performance predicted by our most successful linking hypothesis (d). We considered the idea of a modular IT linking hypothesis with different subregions of IT being devoted exclusively to certain kinds of tasks (e).
a 是四参数空间(脑区、时间窗、位点数、解码器)的实例化总览,各假设的 64 个预测 d' 摆成色带;b 把每条假设压缩成一个一致性柱,虚线与灰带即及格线——IT 蓝柱进入灰带,V4 绿柱、V1/像素/CV 红柱全部显著偏低;c–e 分别检验更细时间码、试次相关、面孔模块化,结果都是"无增益"。这张图一句话浓缩了结果第 2–4 条,也是全文证据密度最高的一张。
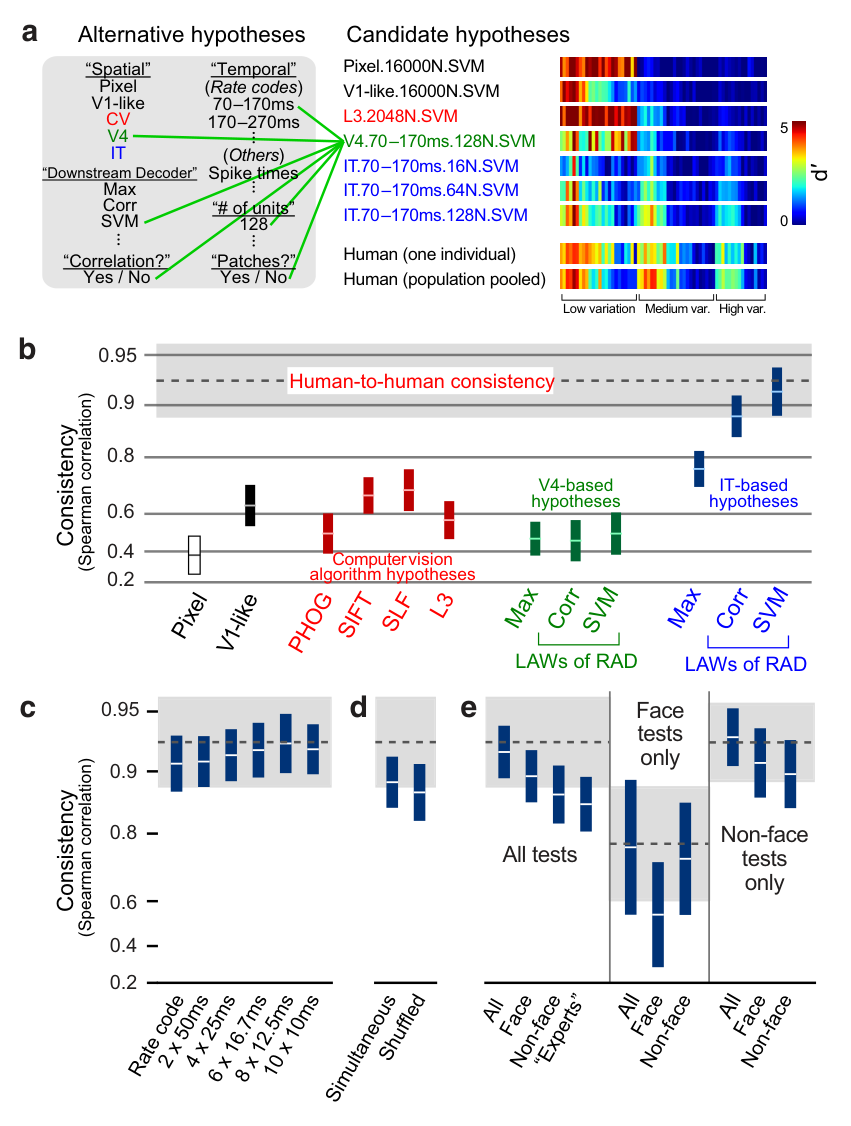
图 6 · 755 个实例化假设的总体散点
原文图注:Figure 6. Exploring a large set of linking hypotheses. The y-axis shows consistency (defined in Fig. 5b) and the x-axis shows performance—the median of the ratio between predicted and actual (human) d' across all 64 tests. In total, we tested 944 types of linking hypotheses, varying the number of neurons/features in each case, for a grand total of 50,685 instantiations considered. Here, we show the results of 755 of those hypotheses. The result of each specific instantiation is shown as a point in the plot with color used to indicate the "spatial" location of the features (IT, V4, V1, or computer vision). We show these examples to illustrate the parameters that we varied, which included spatial location, temporal window, number of units, type of decoder, and a variety of training procedures and train/test splits (see Fig. 10a). The horizontal dashed line indicates the average human-to-human consistency and the horizontal gray band represents variability in human-to-human consistency... Any linking hypothesis that falls in the red dashed circle is perfectly predicting human performance on these 64 tests.
横轴是相对成绩(1 = 与人类等幅),纵轴是一致性,红色虚线圈是"模式 + 幅度"双达标的右上区域。蓝点(IT)是唯一直奔红圈聚集的群体,绿(V4)、黑(V1)、红(CV)点位或低或偏;IT 群体内的纵向散布主要由位点数驱动(接图 7b)。该图把"枚举空间、只此一家"的全景论据可视化,支撑主结果第 2、3 条。
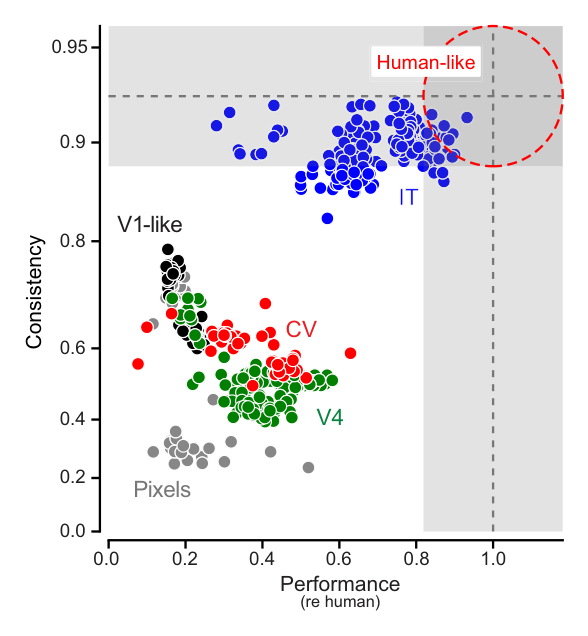
图 7 · 位点数与时间窗的定量效应
原文图注:Figure 7. Effect of number of units and temporal window on consistency and performance. Here, we show the results for the LaWS of RAD linking hypotheses (see text), but results are qualitatively similar for other hypotheses. a, Scattergrams show predicted performance (d') for two neuronal linking hypotheses, IT (blue) and V4 (green), plotted against the actual human performance on all 64 tests: low variation (open circles), medium and high variation (filled circles). The number of units increases from 16 neural sites (left) to 128 neural sites (right). For each linking hypothesis, we also computed its performance: the median of the ratio between predicted and actual human performance across all d' for all 64 tests. b, Performance versus consistency for the V4- and IT-based linking hypotheses as a function of the number of (trial-averaged) units. The curve fits are [IT, r2=0.996; V4, r2=0.91] and they predict that ~529 IT trial-averaged neural sites and ~22,096 V4 trial-averaged neural sites would match human performance under the LaWS of RAD linking hypothesis. c, Consistency for different temporal windows of reading the neural activity. Each point is computed with a 100-ms-wide window and the x-axis shows the center of that window. The number of trial-averaged neural sites was fixed at 128. d, Consistency versus performance for the LaWS of RAD IT linking hypothesis at several progressive temporal windows with the center location starting at the time of image onset (0 ms) and up to 500 ms after image onset. The width of the temporal window was fixed at 100 ms...
a 让人直接看到 V4 的"错位":绿点在高变化测试上压不上去、在低变化测试上又越过人类对角线;b 是关键的拟合图——IT 曲线在足够位点数处进入一致且幅度对齐的区间,拟合给出 529 与 22,096 这两个悬殊数字;c、d 扫描时间窗,IT 一致性在窗口中心约 100 ms 处达到平台并保持约 100 ms。此图支撑主结果第 3 条与第 5 条的前半(数量推算)。
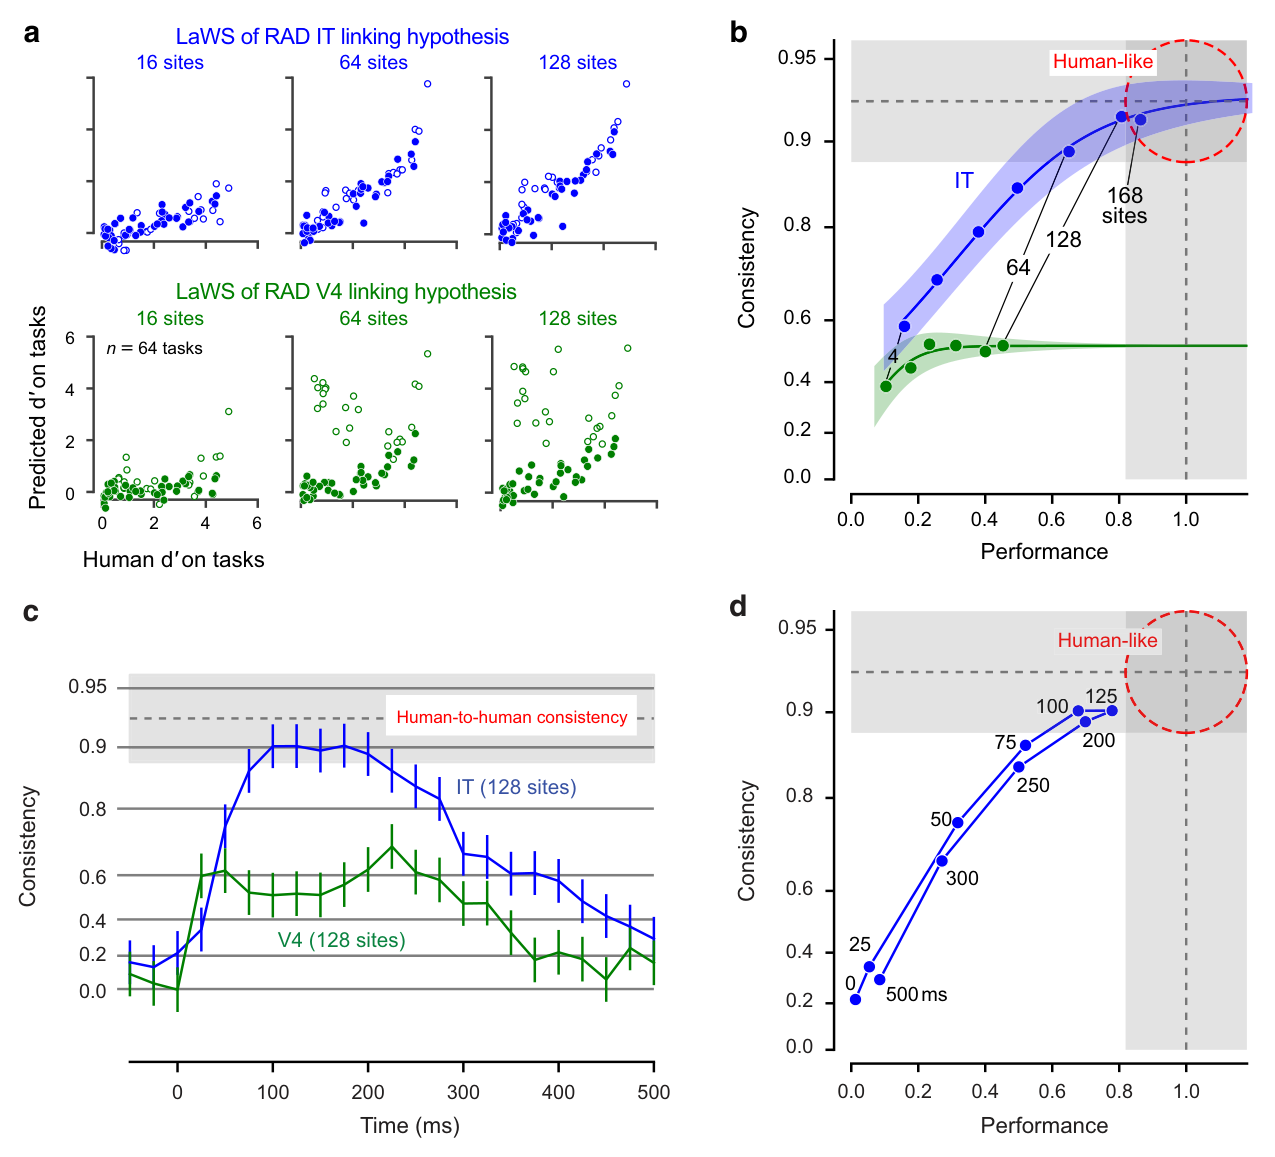
图 8 · 从多单位到单单位、从平均到单试次
原文图注:Figure 8. a, SUA versus MUA linking hypotheses. We used a profile-based spike sorting procedure (Quiroga et al., 2004) and an affinity propagation clustering algorithm (Frey and Dueck, 2007) to isolate the responses of 16 single units from our sample of 168 IT neural sites. The minimum signal-to-noise ratio (SNR) for each single unit cluster was set to 3.5, with SNR defined as the amplitude of the mean spike profile divided by root mean square error (RMSE) across time points. Consistency with the human pattern of performance versus performance for SUA (red) and MUA (black). We estimate that twice as many neurons are needed so that the consistency-performance relationship of our SUA linking hypothesis matches that of our MUA linking hypothesis... b, Single trial versus averaged trials linking hypotheses. Because human subjects were asked to make judgements on single image presentations, we also explored a "single trial" training and testing analysis in which we treated the responses of the neural units to each images presentation as a new and independent set of neural units (i.e., "unrolled" the trial dimension into the unit dimension). Consistency versus performance for the single-trial (red) and the averaged-trial (black) LaWS of RAD linking hypotheses (based on a correlation decoder). We estimate that ~60 times as many neurons are needed so that the consistency-performance relationship of our single-trial hypothesis matches that of our averaged-trials hypothesis.
两幅小图用同一种"一致性 vs 成绩"坐标回答"我们读的是不是真实脑会用的东西":单单位要补约 2 倍位点、单试次要补约 60 倍位点,才能与多单位平均版等价。这两个倍率正是把 529 个平均位点折算成约 6 万单试次单单位的换算依据,支撑主结果第 5 条。
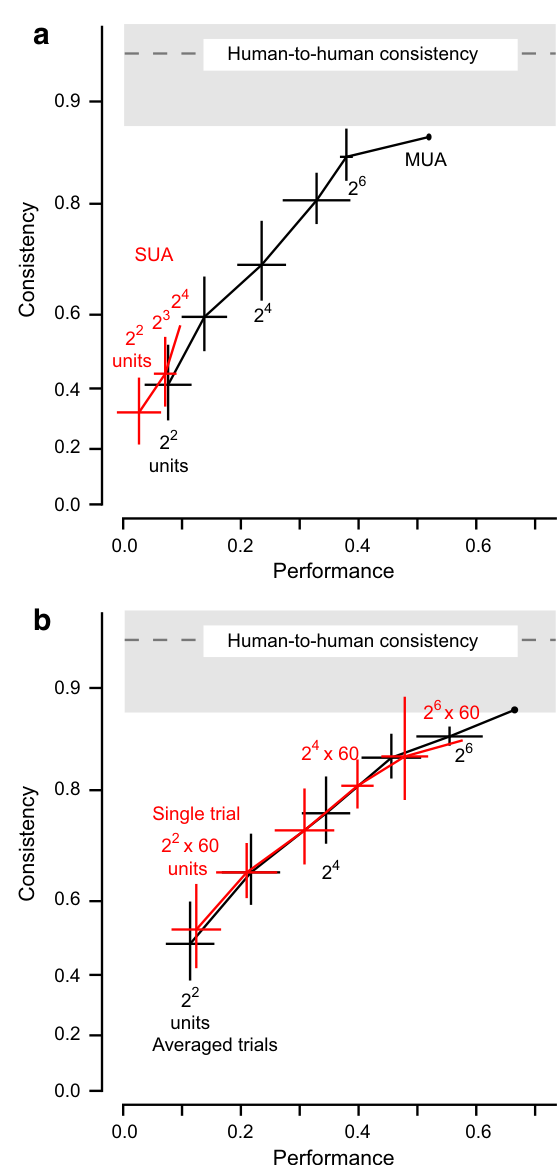
图 9 · IT 三个亚区无本质差别
原文图注:Figure 9. No significant difference in consistency and performance of IT subpopulations was seen when parsed based on anatomical subdivision: PIT versus CIT versus AIT. Based on anatomical landmarks, we could conservatively divide our population of 168 IT neural sites into the following: 76 in PIT, 75 in CIT, and 17 in AIT. a, Comparison of the consistency values for IT populations when neural sites respected anatomical boundaries (PIT vs CIT vs AIT) in contrast to a "control" populations in which the sites were randomly picked from all three anatomical subdivisions. There was no significant difference between the IT populations regardless of whether we restricted our population to 17 neural sites (limiting our analysis to the number of neural sites in AIT our least sampled anatomical subdivision) or expanded to 75 neural sites and compared PIT and CIT. Similarly, performance (b) showed no significant differences between the different IT populations... Consistency and performance were computed based on our typical 70–170 temporal window using an SVM decoder.
按前后轴把 IT 拆成 PIT/CIT/AIT 分别训练解码器,一致性(a)与成绩(b)与对照组(随机取样)无显著差异;小群体下的一致性下降符合位点数效应,而非亚区特异。这为"把 IT 当作一个分布式整体来读"提供了正当性,也排除了"结果由少数前 IT 位点主导"的疑虑。
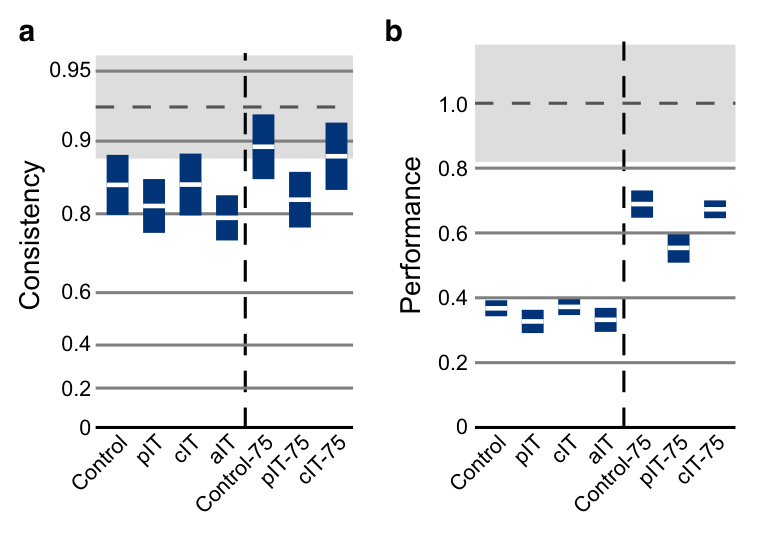
图 10 · 训练协议与"数据换神经元"的权衡
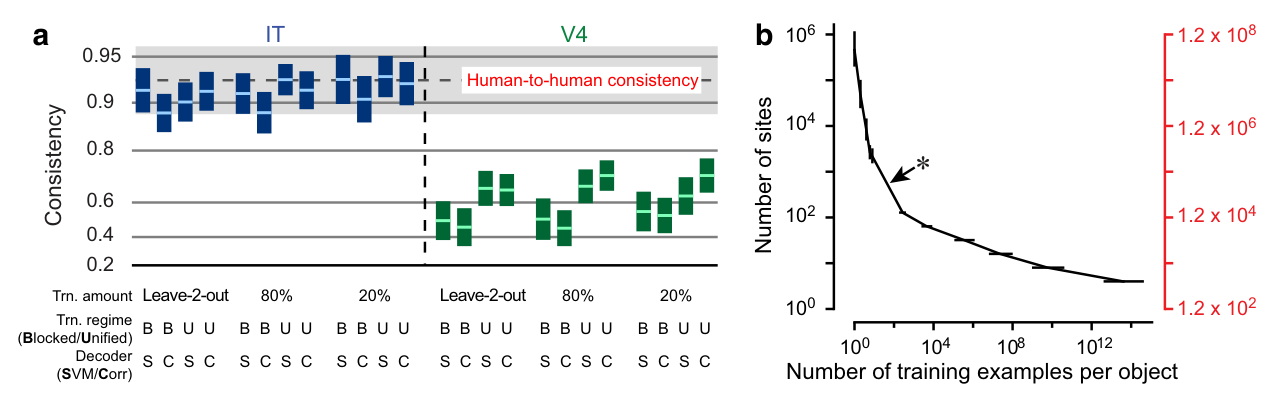
原文图注:Figure 10. a, Effect of the training procedure. Shown are consistency values for LaWS of RAD V4 and IT linking hypotheses under different training procedures. The number of units was fixed to 128 units and the temporal window was 70–170 ms after the onset of the image presentation. Two types of decoders were tested (SVMs and CCs). We also varied the number of images used to train the decoder (leave-2-out: for each class, all images but two were used as the training set and the remaining two were used for testing; 80%: 80% of images were used for training, and the held-out 20% were used for testing; 20%: similar to 80%, but 20% were used for training and 80% for testing). In the blocked training regime, the training and testing of a decoder was done for each variation level separately. For the unified training regime, the decoders were trained across all variations and tested on each variation level separately. b, Trade-off between the sufficient number of units and the number of training images per object for the LaWS of RAD IT linking hypothesis...
a 显示训练量、训练方式(分块/统一)、解码器类型对一致性的影响都不颠覆主结论;b 是一张"用多少神经元 × 用多少训练图"的权衡曲线,黑字为重复平均 MUA 位点需求、红字为对应单试次单单位需求(约 120 倍),星号即约 6 万单单位、每物体约 40 张训练图的组合。它回答了一个朴素质疑:"解码器会不会只是过拟合?"——答案是把训练数据砍到 20% 也一样命中模式。
讨论
作者把这项工作定位为"从定性走向定量"的联接框架:不挑几个概念性任务比较,而是构造一套覆盖人类能力范围的行为测验,让每个编码—解码假设在全部 64 项上过堂。LaWS of RAD IT 通过了这场图灵测试,并且没有靠任何"精巧开关"——试次相关、细粒度时间码、面孔区模块化都未带来可测量的增益。作者谨慎地强调,这并不否证那些更精细的编码(它们在其他任务、其他条件下仍可能起作用),只是说对这组真实世界样式的测试,简单码已经足够;V4 的失败也不是"没采够",而是其表征模式与行为错位——单任务绝对成绩这个惯用量尺恰恰会因为神经元数量而失真。
讨论中最重要的跨物种推论是:猴 IT 的群体响应竟能预测人类的成绩模式,说明两物种共享一种非语义的"形状"表征,它构成核心识别的行为瓶颈,语义层面的理解则是在其上习得的。作者也坦承局限:6 万神经元是外推值,噪声相关等因素可能改变估计;行为数据仅到"每测试平均 d'"层面,尚未逐图像预测混淆模式;本工作刻意回避"IT 响应是如何被制造的"这一上游问题,需要与腹流通路的逐级建模(如 Yamins et al., 2014)合流,才能拼出端到端的理解。
一句话总结
在我看来,这篇文章真正的贡献不是又证明了"IT 很重要",而是把"神经活动如何支撑行为"从口号变成了可以批量证伪的工程命题——而答案朴素得近乎无礼:100 ms 的平均放电率,加上一组学出来的权重,就够了。更值得玩味的是那些"不加分"的叠加项:既然试次相关、精确时间和模块归属在这样苛刻的测试组合上都看不见增益,后续任何声称需要更复杂编码的主张,都得先拿出比这 64 项测试更有分辨力的证据(以上判断是我基于文中论证的个人解读)。
审校与证据追溯 (Verification & Evidence)
图表审计结果
- Fig1: 提取质量
good,对齐度full,识别面板[] - Fig10: 提取质量
good,对齐度full,识别面板[] - Fig2: 提取质量
good,对齐度full,识别面板[] - Fig3: 提取质量
good,对齐度full,识别面板[] - Fig4: 提取质量
good,对齐度full,识别面板[] - Fig5: 提取质量
good,对齐度full,识别面板[] - Fig6: 提取质量
good,对齐度full,识别面板[] - Fig7: 提取质量
good,对齐度full,识别面板[] - Fig8: 提取质量
good,对齐度full,识别面板[] - Fig9: 提取质量
good,对齐度full,识别面板[]
关键事实与局限性声明
- 补充要点: 跨天记录拼接的稳定性对照(论文 Methods):同一电极同日 6 次重复平均 vs 跨日随机抽样 6 次平均,所得 64 项预测 d' 模式的相关分别为 IT 0.908 / V4 0.923——这是把 68/65 天数据拼成一张响应矩阵的关键正当性检验,笔记未提及。
- 补充要点: 二分类(two-way)解码方案的稳健性对照:与 8-way 方案相比绝对成绩差 ~5%、与人类模式的一致性差 ~2%,说明主结论不依赖 8 选 1 的具体实现,笔记未提及。
- 补充要点: 人类基本层分类图像子抽样影响的校正分析(Spearman–Brown 预测,人-人一致性仅上修 ~1.9%),属次要稳健性检查,可酌情补一句。