IT Literature Intelligence 终审版本 (VERIFIED) 论文编号:
311| 原始基线:V0_ZCODE_BASELINE| 语义审核:revise| 图表审核:pass
Distinct auditory and visual tool regions with multisensory response properties in human parietal cortex
Kassuba · Progress in Neurobiology · 2020 · Zotero itemID=2616
这篇研究在 8 名被试每人约 10 小时的 fMRI+DWI 数据里,逐个被试地定位了"工具声音网络"(左前下顶叶 aud-aIPL、左侧中央前沟下部 IPreCS、双侧后侧裂沟 pLS)与"工具图像网络"(左前下顶叶 vis-aIPL、双侧下颞回 ITG),发现左 aIPL 内其实藏着两个前后排列、彼此大致分离的工具子区:偏前下者对听觉工具最锐利,偏后上者对工具的偏好跨模态成立。多体素分析进一步显示 aud-aIPL、vis-aIPL 与 IPreCS 都携带可跨模态迁移的工具类别信息——即"单变量看是模态特定的,多变量看是多感觉的"。这是一篇把"左顶叶工具区"这个粗标签拆解到单被试亚区水平的解剖学论文,也与镜像神经元系统、metamodal 组织等理论直接对话。
研究背景
左前下顶叶皮层(anterior inferior parietal cortex, aIPL)被长期与人类特有的复杂工具使用能力绑定:比较研究(Peeters et al., 2009)表明只有人类——而非猕猴,即便训练其把物体当工具用——在左 aIPL 有工具特异性激活。既往文献中左 aIPL 的工具相关激活名目很多:观看工具使用视频、计划工具使用、用左右手哑剧表演工具使用、命名工具、静态看工具图片、听工具相关声音……但这些都是跨研究、跨被试得到的结论,同一批被试内"听工具声音的顶叶激活"与"看工具图片的顶叶激活"究竟是什么关系,是同区、相邻斑块还是重叠的多感觉表征,并不清楚。此外两个方法学现实构成缺口:顶叶高级区个体间解剖变异很大(Caspers 等、Konen 与 Kastner 的证据),组平均配准容易把邻近功能区糊在一起;而听觉与视觉的工具研究此前几乎各自为政,从来没有人把两条网络放进同一个被试、同一套分析框架里对齐比较。
研究思路
作者的总体策略是"单被试 ROI 优先",明确以小样本、高重复的单被试设计规避跨被试空间标准化造成的解剖平均问题(文中援引 Smith 与 Little 为小样本设计辩护的论述),并使结果便于与非人灵长类研究比较。逻辑链分四步走:第一步,用两个对称的功能定位器(tool-animal localizer)分别在全脑定位"工具声音>动物声音"和"工具图片>动物图片"的网络;第二步,用独立数据(tool category experiment,刺激类别更宽:工具、动物、非工具对照、打乱对照)检验各区工具特异性的成色,并计算类别偏好指数(category preference index, CPI)定量比较同区在两种模态下的偏好;第三步,用多体素模式分析(multivariate pattern analysis, MVPA)做"训练-测试模态分离"的跨模态分类——用听觉数据训练的分类器能否预测视觉数据里的类别——以此检验跨模态的抽象表征;第四步,用 DWI 概率纤维追踪按"与 A1 还是 V1 更可能相连"分割左 aIPL,并用功能连接(层级聚类 + 归一化秩次连接分数)给两条网络画出连接组层面的边界。整个设计的对称性(视听两套完全平行的定位器、实验、指数)是结论可信的关键。
方法
8 名健康右利手被试(25–34 岁,4 女,视听正常),共 7 个 fMRI session + 1 个 DWI session(每人约 10 h;3T Siemens Skyra,20 通道线圈)。三个拓扑映射 session 分别做耳蜗拓扑(tonotopy,250–6400 Hz 对数扫频音,界定 A1/R)、视网膜拓扑(retinotopy,旋转楔形/收缩环形棋盘格)与 IPS 记忆引导扫视任务(界定 IPS0–5)。两个 localizer session:听觉被试听工具使用声(敲、锯、剪)与动物发声(狗吠、猫叫、马喷鼻)各 15 s epoch;视觉看工具、动物、一般物体、打乱物体等 15 s epoch 灰度照片(12°×12°),对比用"工具>动物"(p<0.01,再以"该类别>基线"掩蔽),听觉另界定双侧对动物发声更强的 mSTG。两个 tool category session:四类刺激——工具、动物、非工具对照(听觉为人做非工具动作的声音,视觉为可抓握非工具物体照片)、打乱对照——14 s epoch + 16 s 空屏,每实验 10 runs;被试持续中央注视并做 oddball 检测(声音音量降 10%;图像缩小或降对比),准确率 ≥96%,声音类别经行为评估确认(独立被试组预筛:全部被试都能正确归类且命名最快的 25 个/类)。分析:AFNI GLM,体素级对比 + ROI 内平均;CPI 为基于 d' 的类别偏好指数(0 到 ±1);MVPA 用 Princeton 工具箱的线性朴素贝叶斯分类器做 9 mm 半径 searchlight,只分工具 vs 动物,留一交叉验证,四种训练-测试组合(听-听、视-视、听-视、视-听);功能连接先回归掉刺激诱发响应再算 ROI 时间曲线相关,做平均连接层级聚类与归一化秩次分数;DWI 用 FSL,ball-and-stick 双纤维模型概率追踪(每体素 5000 条流线),按到达 A1 或 V1 的样本数把左 aIPL 每个体素二分类。
主要结果
- 两条工具网络(图 2、图 3)。听觉定位器在全部 8 人找到左 aud-aIPL(前缘上回前部、邻中央后沟,Talairach 约 -57,-26,30),另在左 IPreCS、双侧 pLS、左 aLS 与左 pMTG(后两者仅 7/8 人)找到工具偏好活动;动物声音则激活双侧 mSTG。类别实验确认左 aud-aIPL 与双侧 pLS 对工具声的响应稳定强于动作声、动物声与打乱声(t>3.76),IPreCS 呈边缘性趋势(t(6)=3.21, p=0.0549)。视觉侧:vis-aIPL(8/8 人,中央后沟旁、IPS5 下邻)加左 IPreCS(与听觉工具激活重叠)、双侧 ITG、双侧 PHC,动物图片激活双侧 MTLO;类别实验中左 vis-aIPL(而非右半球同区)与双侧 ITG 对工具图显著强于可抓握物体、动物与打乱图(t≥5.93);PHC 其实偏好可抓握物体,不算工具特异。
- 单变量层面:听觉网络模态锁死,视觉网络跨模态(图 4)。CPI 显示左 aud-aIPL、左 IPreCS、双侧 pLS 强偏好听觉工具(对动物、对动作声均 >0,p≤0.03),但对视觉工具刺激无偏好(p>0.15);跨模态比较的模态主效应显著(如 tools-animals:F(1,15)=14.62, p=0.0123)而无模态×ROI 交互。相反,左 vis-aIPL 与左 ITG 不仅偏好视觉工具(对动物 t≥3.45、对可抓握物体 t≥5.43),左 vis-aIPL 还偏好工具声音(对动物声 t(6)=5.18, p=0.0031)、左 ITG 偏好工具相对动作声(t≥3.24)——且两区听觉与视觉 CPI 无显著差异(p>0.33)。V1 对视觉工具响应反而较弱(工具细长、覆盖视野小),但高级区的工具特异性并非从 V1 顺流而下。
- MVPA 揭示多感觉响应特性(图 5)。左 aud-aIPL 与 IPreCS 的跨模态分类(听-视、视-听)显著高于机会水平(t≥3.05, p≤0.045);左 vis-aIPL 跨模态分类同样超机会且与单模态分类相当(t≥4.16, p≤0.012);而 pLS 与 A1 只在听觉-听觉上强、ITG 与 V1 只在视觉-视觉上强。即 pLS/ITG 的类别信息锁在各自"偏好"模态内,aud-aIPL、vis-aIPL、IPreCS 的激活模式则携带可跨模态迁移的工具信息。
- 左 aIPL 内两个子区呈反向梯度(图 6)。aud-aIPL 与 vis-aIPL 沿中央后沟呈前下—后上排列,个体间关系从分离(S1–S3)、相邻(S4)、部分重叠(S5–6)到几乎完全覆盖(S7–8)不等。把 aIPL 切成 aud-aIPL(excl. vis)、中间区、vis-aIPL(excl. aud) 三段后,工具偏好沿前下→后上轴呈相反方向的梯度(模态×ROI 交互 F(2,10)=8.05, p=0.0082):改为:听觉偏好峰在前下、谷底在后上,视觉偏好正好相反。关键控制:把重叠区剔除后,两个子区的跨模态 MVPA 结果不变(t≥3.56, p≤0.018),说明多感觉性不是重叠体素造成的。
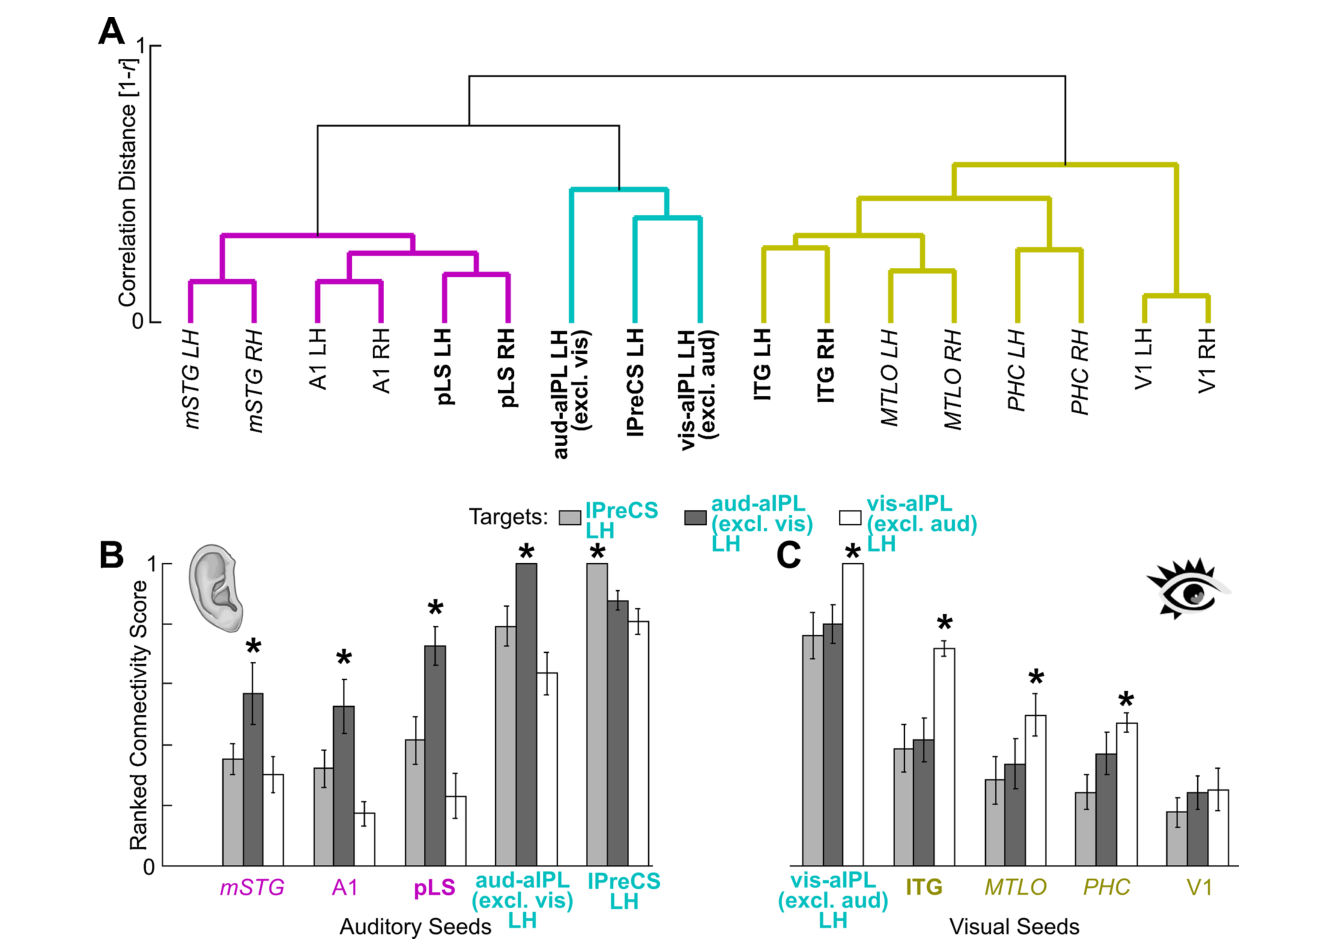
- 解剖与功能连接都支持这种分割(图 7、图 8)。概率追踪显示左 aIPL 总体与 A1 更可能相连(F(1,6)=6.09, p=0.0487)——部分是距离效应(aIPL 距 A1 比距 V1 近 6.0±0.9 cm 与 3.5±1.3 cm);但控制相对量后,aud-aIPL(excl. vis) 与 A1 的相对连接显著高于与 V1(t(7)=4.25, p=0.0113)也高于 vis-aIPL(excl. aud)(t(7)=2.44, p=0.0448),而 vis-aIPL(excl. aud) 对 A1/V1 等同(p>0.99);基于连接的分割边界与功能区边界基本吻合,中间区更像两区的混合体而非过渡带。功能连接层级聚类得到三簇:听觉簇(品红)、视觉簇(黄)、以及由左 IPreCS、aud-aIPL、vis-aIPL 组成的第三簇(蓝)——三个多感觉节点彼此强互连,听觉种子(pLS、mSTG、A1)最强连接 aud-aIPL,视觉种子(ITG、MTLO、PHC,V1 除外)最强连接 vis-aIPL。
图注解读
图 1 · 听觉与视觉工具类别实验的实验设计
原文图注:Fig. 1. Experimental design for the auditory and visual tool category experiments. In two separate sessions, tool-related activation profiles were tested using either visual or auditory stimuli. In the auditory experiment, subjects listened to sounds created by the usage of tools, (e.g., hammering, sawing, cutting something with scissors), non-tool action sounds (e.g., dialing phone, crumbling paper, knocking on door), animal vocalizations (e.g., dog barking, cat meowing, horse snorting), and scrambled sounds (noise). Correspondingly, in the visual experiment, subjects viewed static photographs of tools, non-tool graspable objects, animals, and scrambled pictures. The stimuli were presented in 14 s blocks interleaved with 16 s silent fixation-only blocks. Subjects were instructed to keep their eyes open and fixate at all times while detecting oddball stimuli (auditory: lower volume; visual: either smaller size or lower contrast).
设计示意图:两个独立 session 分别用听觉与视觉刺激检验工具相关激活谱。将“听漏述列”修改为“听觉实验”或“听觉刺激”。工具使用声(敲、锯、剪)、非工具动作声(拨号、揉纸、敲门)、动物发声(狗吠、猫叫、马喷鼻)、打乱声(噪声);视觉实验对应四类照片——工具、非工具可抓握物体、动物、打乱图。刺激以 14 s 区组呈现、间隔 16 s 静默注视区组;被试全程睁眼注视并检测 oddball(听觉为音量降低,视觉为尺寸缩小或对比降低)。这张图交代了全文比较框架的对称性:两条模态网络用完全平行的四类刺激测量,是后文所有跨模态结论的设计基础。
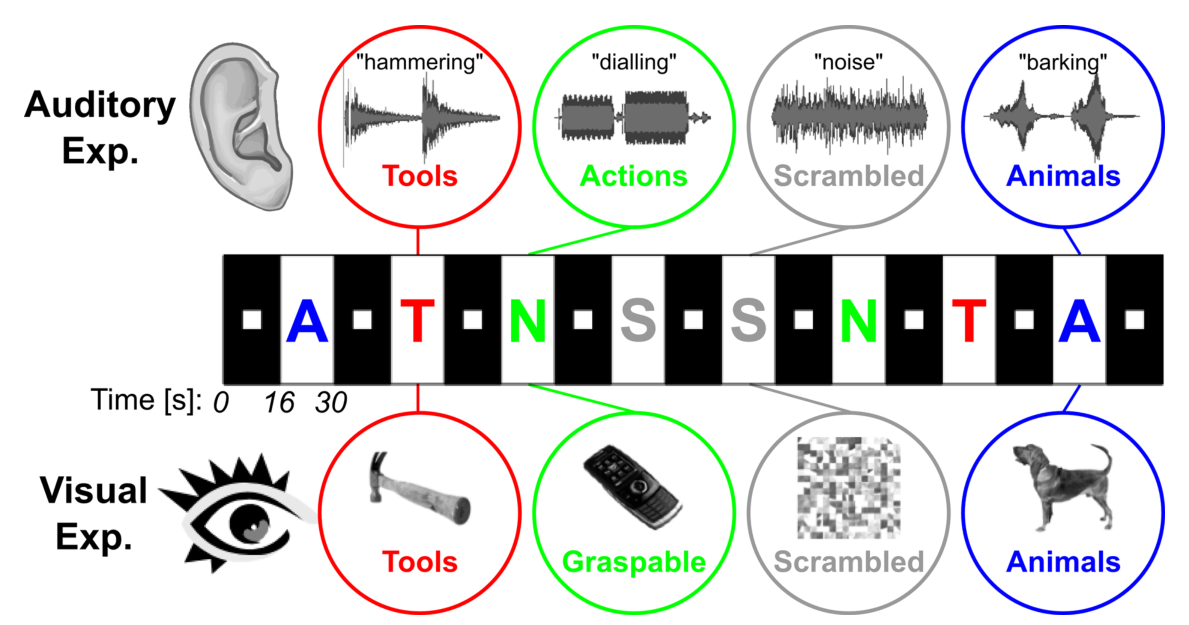
图 2 · 听觉模态的工具网络
原文图注:Fig. 2. Tool-related activations in the auditory modality. A. Tool- and animal-related regions of interest (ROIs), as identified in the auditory tool-animal localizer. The activation map shows the contrast auditory tools (red) versus animals (blue) presented on the inflated cortical surface of a representative subject (S8; p < 0.01, uncorrected). The asterisk () denotes the tool-related (tools > animals) activation peak in left anterior inferior parietal cortex (aud-aIPL). Additional activations were found in the left inferior precentral sulcus (IPreCS), bilateral posterior lateral sulcus (pLS), left anterior LS (aLS), and left posterior middle temporal gyrus (pMTG). Regions activated more strongly by animal-related sounds were found in bilateral middle superior temporal gyrus (mSTG). Tonotopic areas (A1/R) are outlined in black. B. Mean percent signal changes in response to tool (red), action (green), animal (blue), and scrambled sounds (grey) in the auditory tool category experiment. Left aud-aIPL, left IPreCS, and bilateral pLS responded consistently stronger to tools than to any other category. Error bars indicate the standard error of the mean. Significant auditorily evoked response (category > baseline) that was significantly stronger for the category indicated by the respective color than for the other categories, p ≤ 0.05, corrected.
A:示例被试(S8)膨胀皮层表面上"工具声(红)>动物声(蓝)"的激活图——星号标出左 aud-aIPL 的峰值,另有左 IPreCS、双侧 pLS、左 aLS、左 pMTG;蓝色为双侧 mSTG(动物声偏好);黑色轮廓为耳蜗拓扑定义的 A1/R。B:类别实验中各 ROI 对四类声音(红=工具、绿=动作、蓝=动物、灰=打乱)的平均百分信号变化——左 aud-aIPL、左 IPreCS、双侧 pLS 的红柱最高且星号标记显著;配合 Table 1 的被试平均 Talairach 坐标与激活百分比。此图支撑主要结果第 1 条的听觉侧:工具声音网络由这些节点构成,且在独立数据上确认工具特异性。
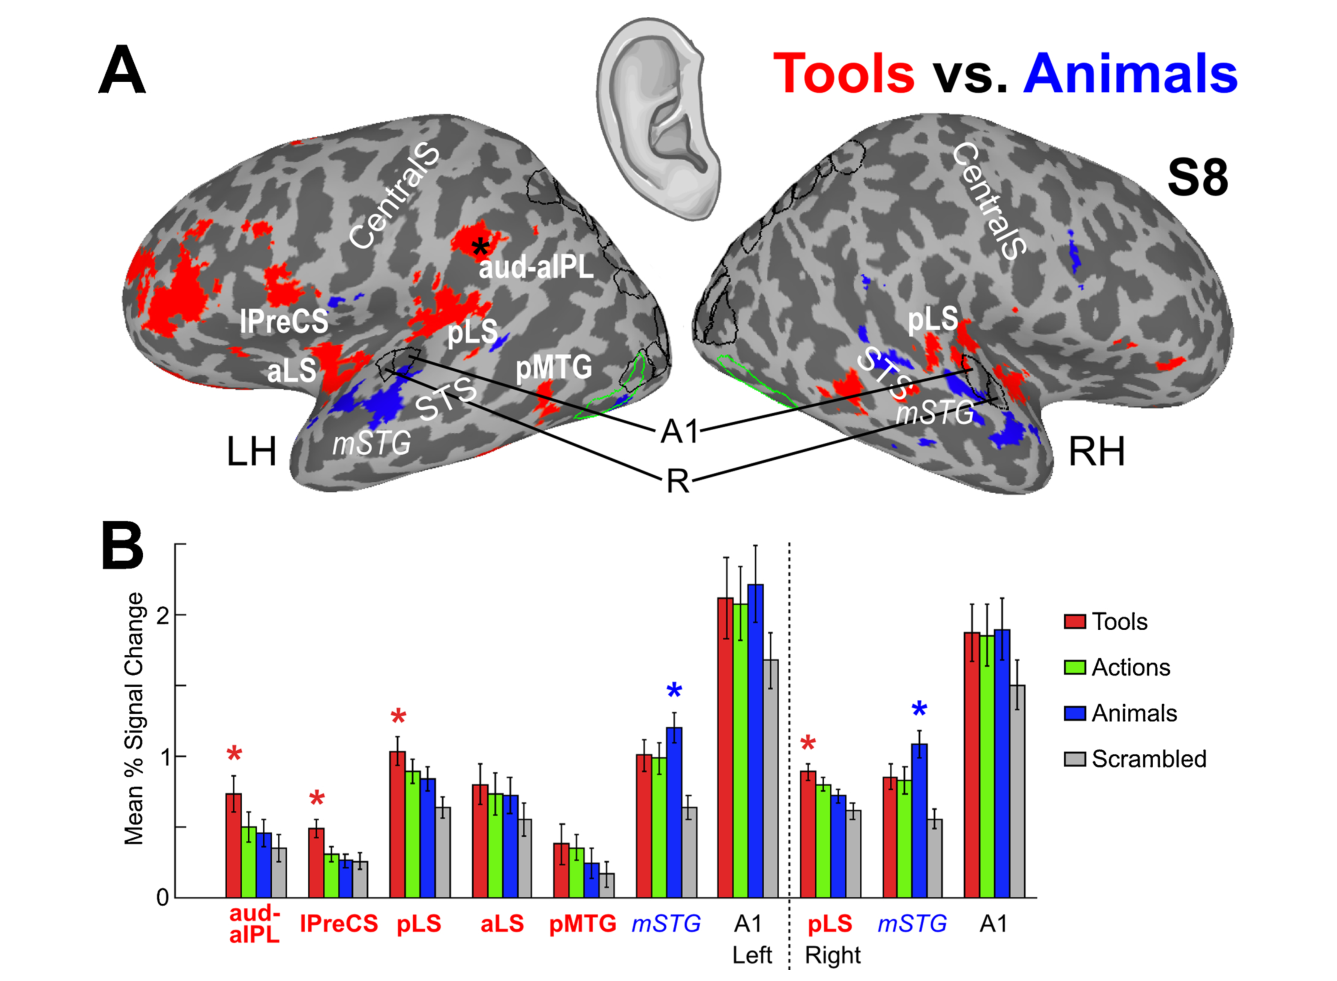
图 3 · 视觉模态的工具网络
原文图注:Fig. 3. Tool-related activations in the visual modality. A. Tool- and animal-related regions of interest (ROIs), as identified in the visual tool-animal localizer. The activation map shows the contrast visual tools (red) versus animals (blue) presented on the inflated cortical surface of a representative subject (S8; p < 0.01, uncorrected). The asterisk () denotes the tool-related (tools > animals) activation peak in left anterior inferior parietal cortex (vis-aIPL). Additional visual tool- related ROIs: left inferior precentral sulcus (IPreCS), bilateral inferior temporal gyrus (ITG), bilateral parahippocampal cortex (PHC, not visible in this view). Visual animal-related ROI: bilateral middle temporal/lateral occipital cortex (MTLO). Retinotopic areas (IPS0-5, LO1-2) are outlined in black, and object-specific lateral occipital complex (LOC: objects > scrambled) is outlined in green. B. Mean percent signal changes in response to images of tools (red), graspable objects (green), animals (blue), and scrambled images (grey) in the visual tool category experiment. Left vis-aIPL and bilateral ITG responded consistently stronger to tools than to any other category. Error bars indicate the standard error of the mean. Significant visually evoked response (category > baseline) that was significantly stronger for the category indicated by the respective color than for the other categories, p < 0.05, corrected.
A:S8 表面上"工具图(红)>动物图(蓝)"的激活图——星号标左 vis-aIPL(注意其位于后上、与图 2 的 aud-aIPL 不同),另有左 IPreCS、双侧 ITG、双侧 PHC(此视图不可见);蓝色为双侧 MTLO(动物图偏好);黑色轮廓为 IPS0–5、LO1–2 视网膜拓扑区,绿色轮廓为 LOC。B:类别实验柱状图(红=工具、绿=可抓握物体、蓝=动物、灰=打乱)——左 vis-aIPL 与双侧 ITG 的工具柱显著最高。与图 2 并读即可见"两条网络在前部顶叶/前运动区交汇、在颞叶分道"的格局,支撑主要结果第 1 条的视觉侧。
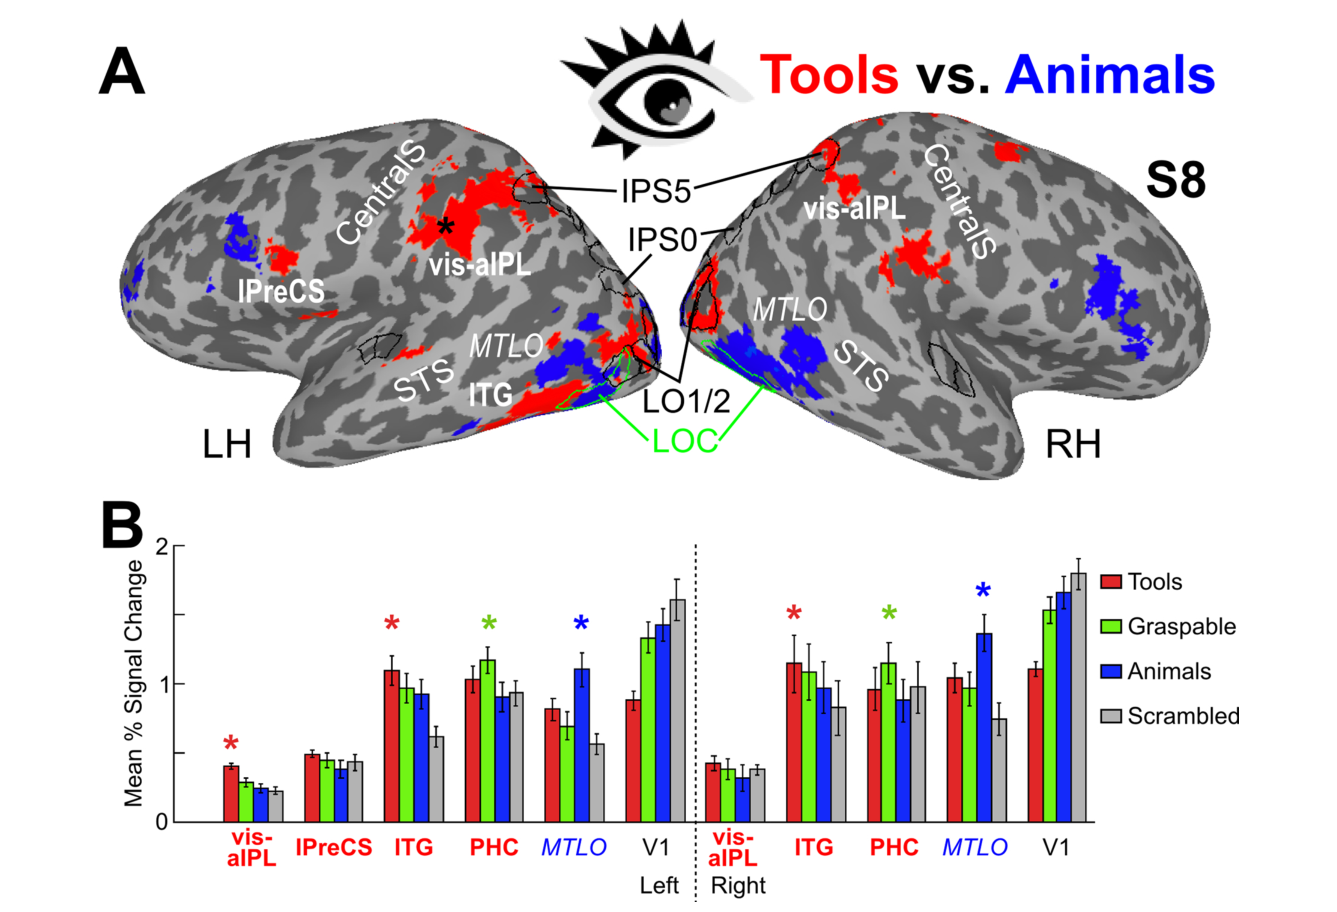
图 4 · 类别偏好指数:模态内的锐利与跨模态的松动
原文图注:Fig. 4. Category preference indices (CPIs) for auditory (A/B) and visual (C/D) tool-related regions (bold labels) and early sensory cortices (A1/V1). Gray and white bars denote the auditory and visual modality, respectively. The CPI quantifies the preference of a given region for a given stimulus category on a scale of 0 (no preference) to +/- 1 (strong preference). A./C. Positive values indicate stronger responses to tools, negative values indicate stronger responses to animals. B./D. Positive values indicate stronger responses to tools, negative values indicate stronger responses to actions (auditory stimuli) or graspable objects (visual stimuli). Auditory tool- related regions such as left aud-aIPL, left IPreCS, and bilateral pLS showed a strong preference for tool stimuli over animal and non-tool stimuli in the auditory but not in the visual domain, whereas visual tool-related regions such as left vis-aIPL and left ITG showed a strong preference for visual and auditory tool stimuli over animal and non-tool stimuli, particularly in the left hemisphere. Auditory ROIs: aud-aIPL = auditory tool-related anterior inferior parietal lobe, IPreCS = inferior precentral sulcus, pLS = posterior lateral sulcus, A1 = tonotopic primary auditory cortex. Visual ROIs: vis-aIPL = visual tool-related aIPL, ITG = inferior temporal gyrus, V1 = retinotopic primary visual cortex. Error bars indicate the standard error of the mean. *CPIs significantly different from zero, p ≤ 0.05, corrected. See Results for further significant effects.
读图要点:每区两根柱,灰=听觉模态 CPI、白=视觉模态 CPI;A/C 的正负方向是"工具 vs 动物",B/D 是"工具 vs 动作声(听)/可抓握物体(视)";星号=与零显著不同(p≤0.05 校正)。核心对照:听觉工具区(左 aud-aIPL、左 IPreCS、双侧 pLS)只有灰柱显著为正——工具偏好锁死在听觉域;视觉工具区(左 vis-aIPL、左 ITG)灰白两柱都显著为正——工具偏好跨模态成立。A1/V1 基本平坦(V1 视觉 CPI 为负,反映工具细长形覆盖视野小)。此图是主要结果第 2 条的定量呈现。
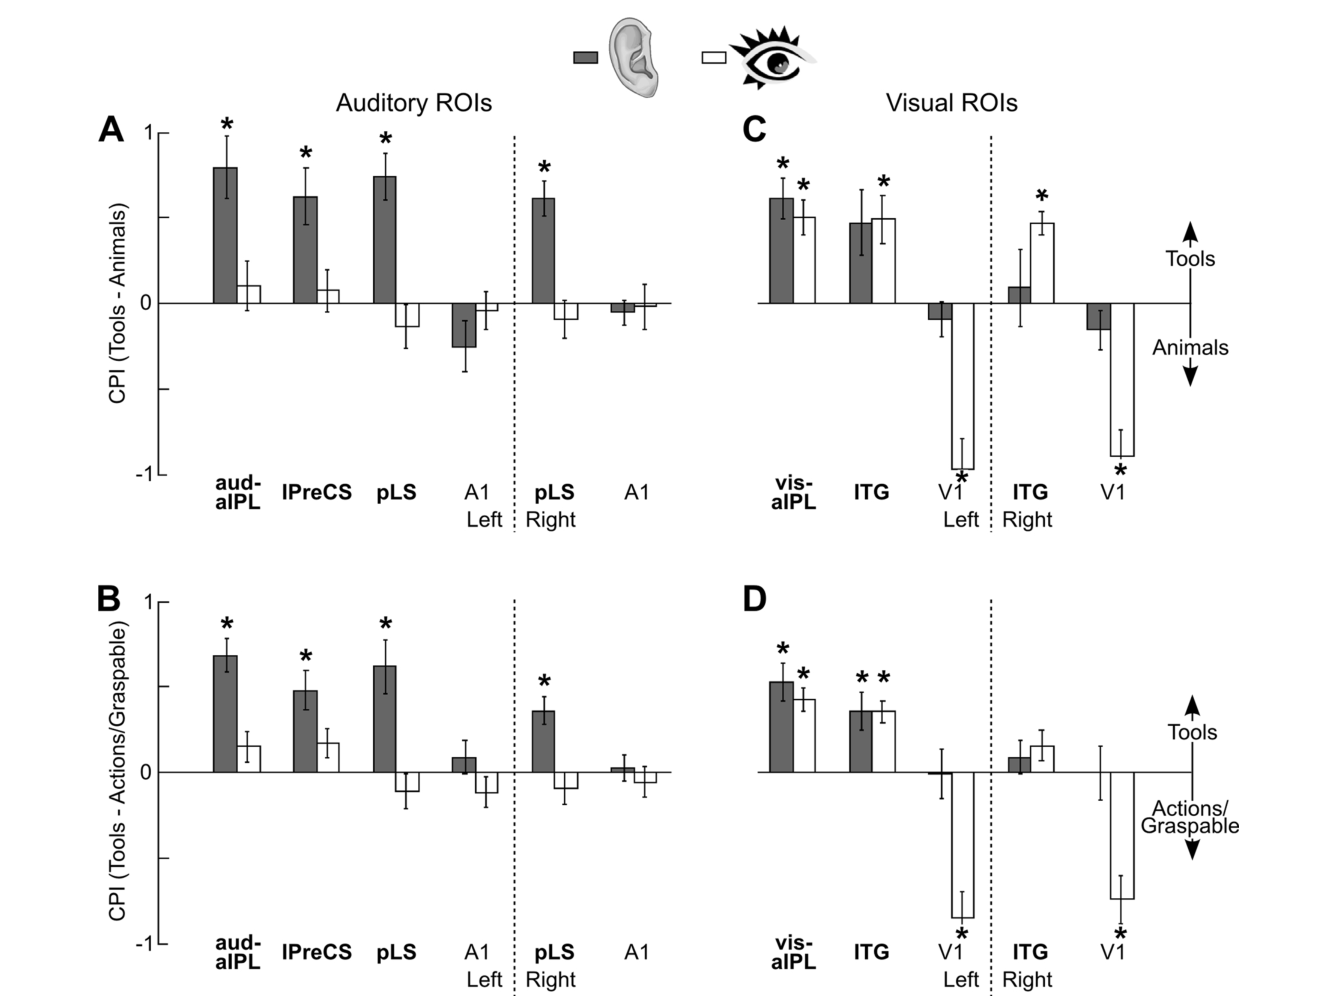
图 5 · 跨模态 MVPA:哪些区的激活模式可跨感官解码
原文图注:Fig. 5. Unimodal and cross-modal tool specificity revealed by multivariate pattern analyses (MVPAs). A. Approach. A classifier was trained to discriminate between activations associated with perceiving tool versus animal stimuli using either data from the auditory or the visual experiment. Its performance was then tested on data from the same (unimodal classifications: auditory-auditory in magenta, visual-visual in yellow) or the respective other experiment (crossmodal classifications: auditory-visual in coral, visual-auditory in cyan). B. Classification accuracy in auditory tool-related regions (bold labels) and A1, and in C. in visual tool-related regions (bold labels) and V1. Error bars indicate the standard error of the mean. *Significant classification performance above chance, #significantly better auditory- auditory than visual-visual classification performance (B.) or vice versa (C.), p < 0.05, corrected.
A 说明四种训练-测试组合(品红=听-听、黄=视-视、珊瑚色=听-视、青=视-听)。B、C 为各 ROI 的分类准确率(0.5 为机会水平)。读法:pLS 与 A1 只有品红柱过机会线且带 #(听-听优于视-视),ITG 与 V1 只有黄柱过线(C 中 # 反向);而左 aud-aIPL、IPreCS、左 vis-aIPL 的四种柱都过机会线——它们的体素模式在"用听觉数据训练、测视觉数据"(或反向)时仍能解码出工具 vs 动物,即携带跨模态抽象的工具信息。此图支撑主要结果第 3 条,也是全文标题里"multisensory response properties"的证据来源。
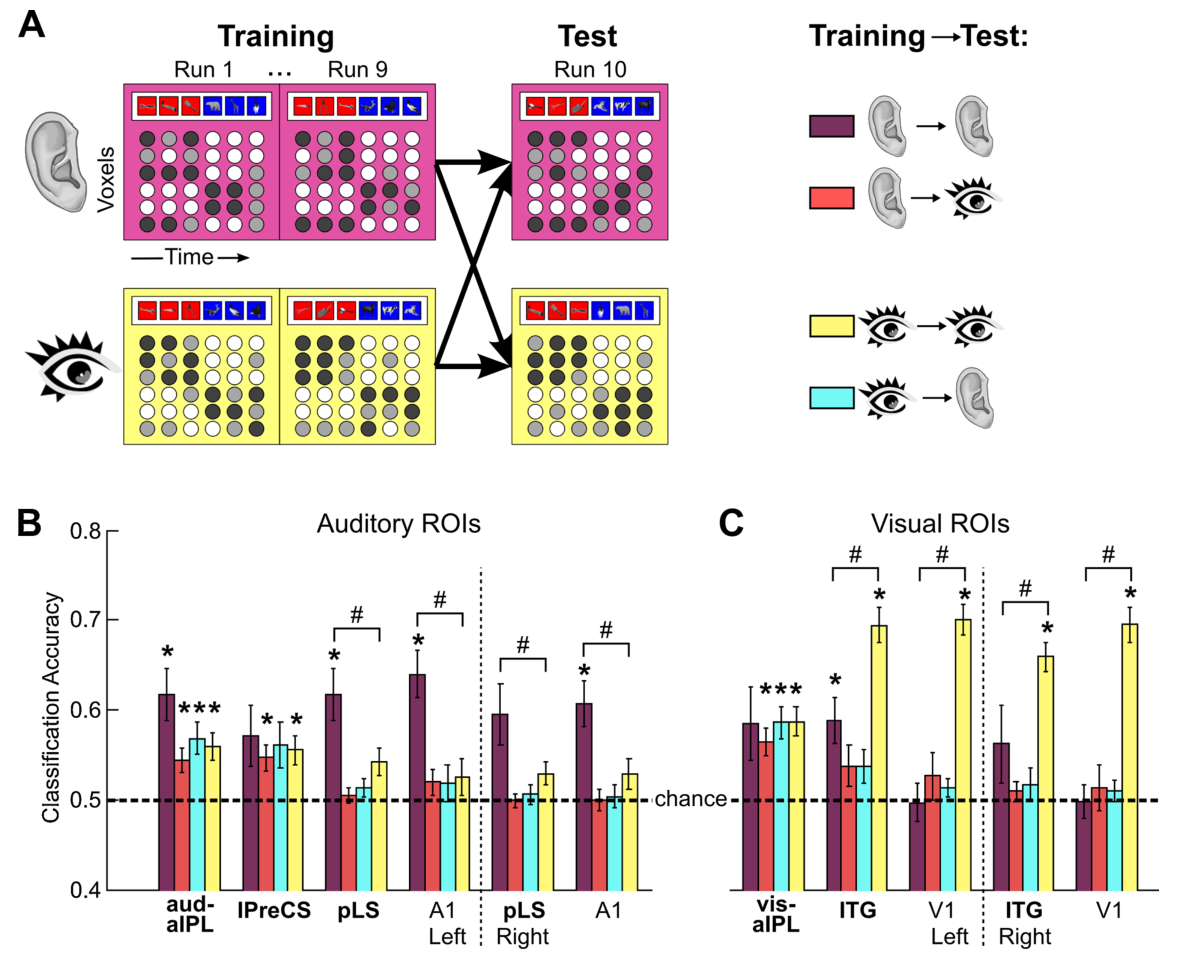
图 6 · 左 aIPL 两个子区的空间关系与反向梯度
原文图注:Fig. 6. Auditory and visual tool-related activations in left aIPL. A. Spatial arrangement of aud-aIPL and vis-aIPL in individual subjects (S1-S8). The aud-aIPL (outlined in solid black) was consistently located more anterior/inferior along the postcentral sulcus relative to the vis-aIPL (outlined in solid white). Across subjects, the two regions were located spatially apart (S1-S3), adjacent (S4), partially overlapping (S5-S6), or overlapping such that the smaller of either region was almost completely covered by the other (S7-8). The dotted gray line indicates the extent of the intermediate aIPL ROI in subjects with no overlap of aud-aIPL and vis-aIPL. CentralS = central sulcus, LS = lateral sulcus. B./C. Tool-related category preference indices (CPIs) in left aIPL subregions in response to auditory (grey bars) and visual (white bars) stimuli, where positive values indicate stronger responses to tools and negative values indicate stronger responses to animals (B.), or actions (auditory stimuli) and graspable objects (visual stimuli)(C.). Overall, there was a gradient in the tool-related (tools > non-tools) and sensory response (versus baseline) along the anterior/inferior-to-posterior/superior axis in left aIPL, which was reversed for auditory and visual stimuli. Auditory tool preference peaked in the anterior/inferior aud-aIPL (excl. vis), while visual tool preference peaked in the posterior/superior vis-aIPL (excl. aud). Error bars indicate the standard error of the mean. *CPIs significantly greater than zero, p < 0.05, corrected. See Results for further significant effects.
A:逐被试(S1–S8)画出 aud-aIPL(黑实线)与 vis-aIPL(白实线)在左 aIPL 的相对位置——一致地 aud 在前下、vis 在后上,但个体间从分离到几乎完全覆盖不等;灰色虚线为无重叠被试的中间区 ROI 范围。B/C:把 aIPL 切成三段(前下 aud 专属、中间、后上 vis 专属)后的 CPI——听觉工具偏好(灰柱)在前下段最强、沿轴向后上递减;视觉工具偏好(白柱)在后上段最强、向前下递减,两方向相反(线性趋势×模态 F(1,5)=14.89, p=0.0119)。此图支撑主要结果第 4 条:左 aIPL 不是一块均质的"工具区",而是两个功能与位置都可分的子区沿一条轴形成反向梯度。
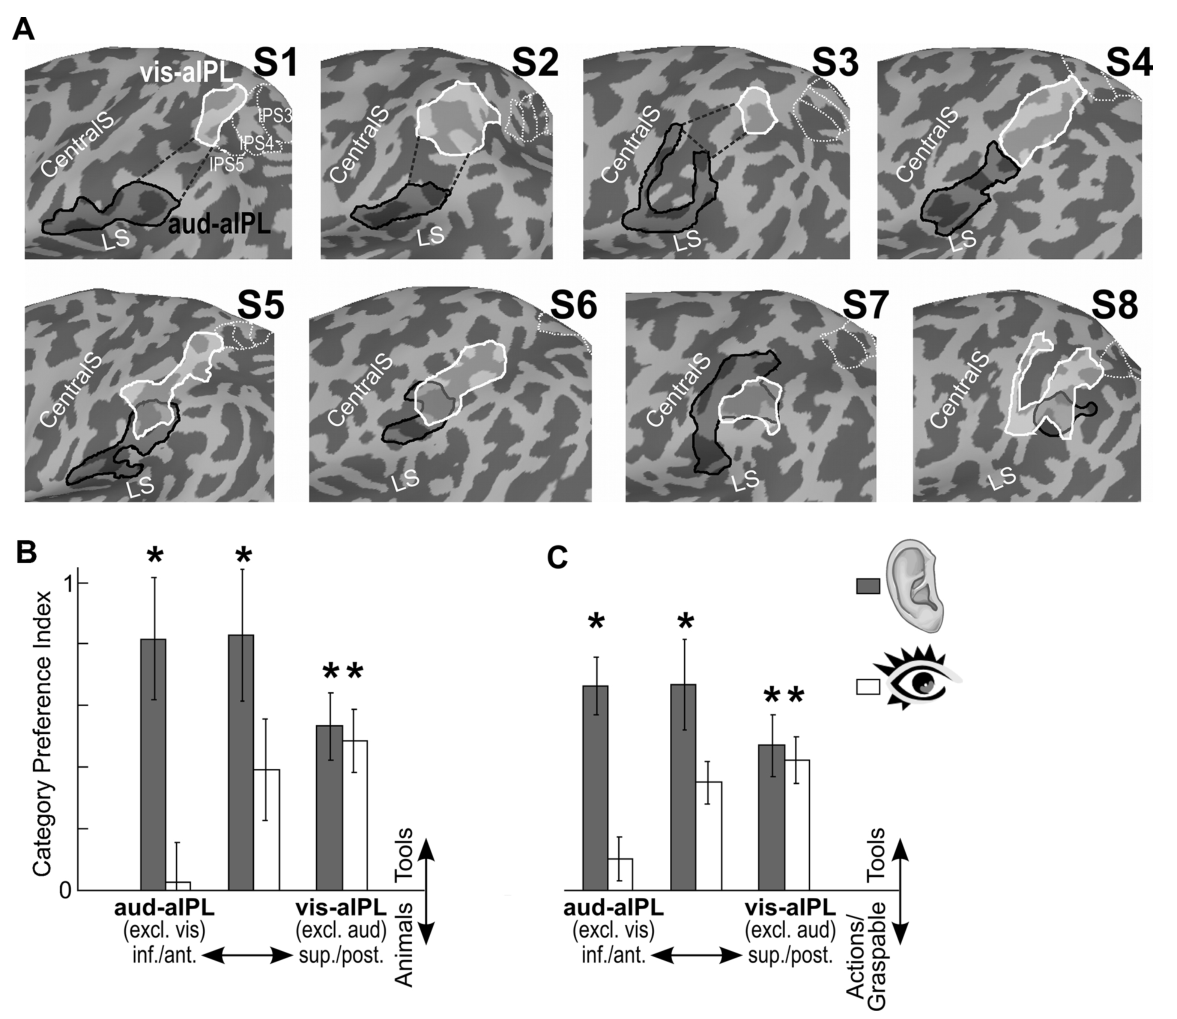
图 7 · 按 A1/V1 解剖连接分割左 aIPL
原文图注:Fig. 7. Segmentation of left aIPL based on probabilistic anatomical connectivity with A1 (magenta) versus V1 (yellow). A. Percent voxels more likely connected to A1 versus V1 in the left aIPL ROIs. *Higher probabilistic connectivity of aud-aIPL with A1 than V1 and than vis-aIPL with A1, p < 0.05, corrected. B. Comparison of connectivity-based segmentation with functionally defined auditory (black outline) and visual (white outline) aIPL tool regions in five representative subjects (S2-S4, S8). Voxels are color-coded based on whether they were more likely connected to A1 (magenta) or V1 (yellow). The segmentation of left aIPL by probabilistic anatomical connectivity to A1/V1 shows a similar inferior/superior arrangement as for the functional localization.
A:各 ROI 内"更可能连 A1"的体素百分比(品红)与"更可能连 V1"(黄)——aud-aIPL(excl. vis) 连 A1 显著多于连 V1、也多于 vis-aIPL(excl. aud) 连 A1(p<0.05 校正),vis-aIPL(excl. aud) 两者持平。B:五个代表被试(S2–S4、S8)中按连接的体素二分类图与功能定义的听觉(黑线)/视觉(白线)区叠加——品红/黄的边界与功能区的 inferior/superior 排列大致吻合,且这种区分不能用与 A1/V1 的空间远近解释。此图为功能上的两个子区提供了独立于功能数据的解剖学佐证,支撑主要结果第 5 条;作者同时坦承 aIPL 整体距 A1 更近造成的偏置,故以"相对连接"作主要推断。
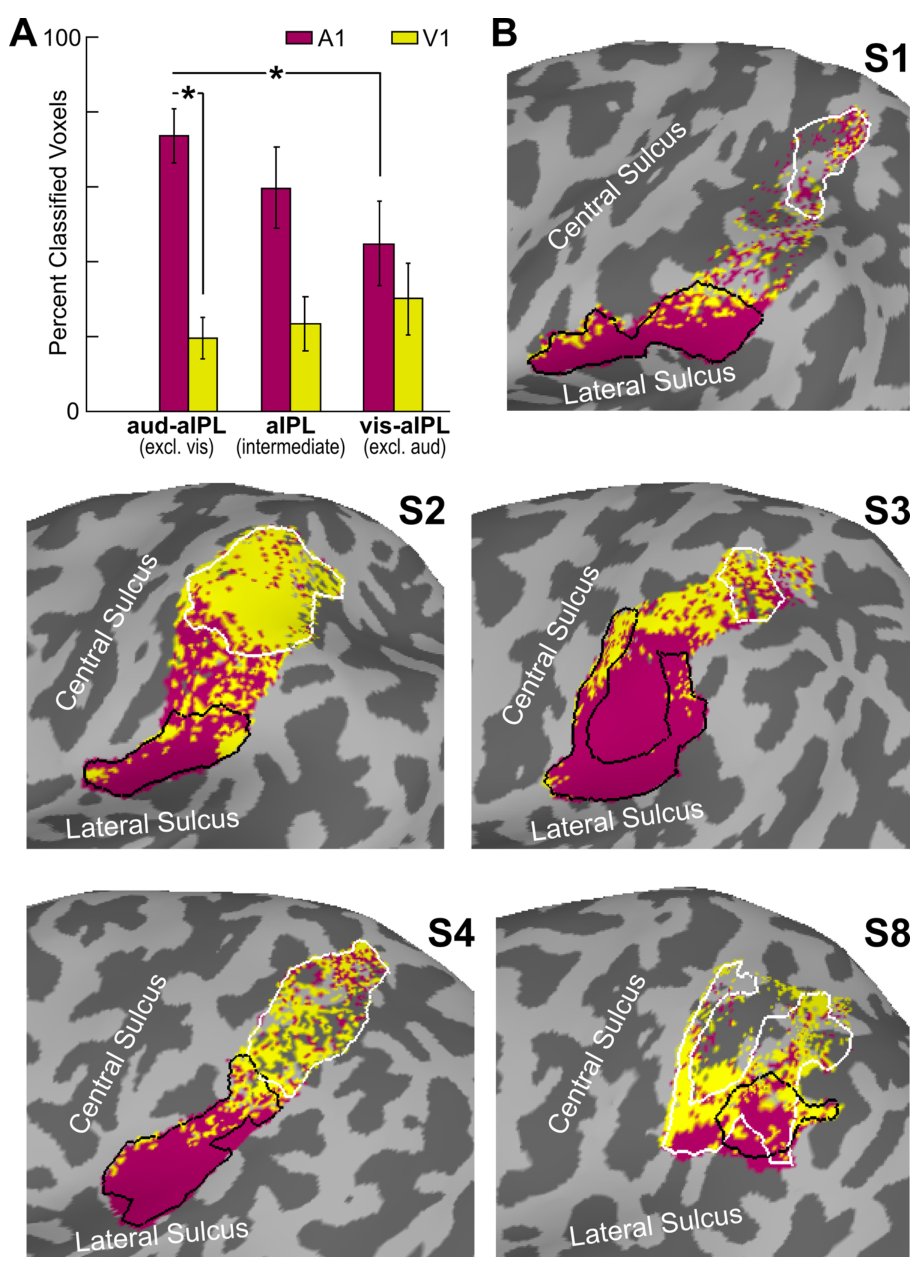
图 8 · 功能连接:三簇结构与多感觉枢纽
原文图注:Fig. 8. Functional connectivity. A. Hierarchical clustering of auditory and visual tool-related regions (bold labels), other category-related regions (italic labels) and primary cortices based on their functional connectivity similarities (1-r). The clustering identified three main groups of regions: auditory regions (magenta), visual regions (yellow), and a third group consisting of left IPreCS, aud-aIPL, and vis-aIPL (blue). LH = left hemisphere, RH = right hemisphere. B./C. Normalized ranked connectivity scores of auditory (B.) and visual (C.) seed regions (collapsed across hemispheres) with the left IPreCS (light gray bars), aud-aIPL (dark grey bars), and vis-aIPL (white bars) target regions. While the aud-aIPL, vis-aIPL, and IPreCS (blue labels) were strongly connected with each other, the remaining auditory regions (magenta labels) were most strongly connected with aud-aIPL, and the remaining visual regions except V1 (yellow labels) were most strongly connected with vis-aIPL. *Indicates target region most strongly connected with given seed region (i.e., significantly higher connectivity than other target regions), p < 0.05, corrected. See Results for further significant differences.
A:以连接距离(1−r)做层级聚类,得到三簇——品红听觉簇(含 A1 与工具偏好 pLS 比动物偏好 mSTG 更近)、黄色视觉簇(类别区与 V1 分开)、蓝色第三簇(左 IPreCS、aud-aIPL、vis-aIPL:即三个多感觉节点抱团)。B/C:以听觉(B)或视觉(C)区域为种子、三个 aIPL/IPreCS 区为靶的归一化秩次连接分数——听觉种子(pLS、mSTG、A1)显著最强连接 aud-aIPL(*号),视觉种子(ITG、MTLO、PHC)最强连接 vis-aIPL,V1 对三个靶无差别;三个蓝色节点彼此连接同等强。此图给出网络拓扑层面的结论(主要结果第 5 条):两条模态网络各自汇聚到左顶叶的一个节点,三个节点再互相抱团,构成潜在的跨模态整合枢纽。
讨论
作者的解读沿三个方向展开。其一,功能分工假说:aud-aIPL 与 Peeters 等(2009)的人类特异工具动作区位置几乎重合(其 MNI -60,-21,31 对本文 -60,-25,32),该区可能在"动作识别"层面运作——无论动作是主动做出(哑剧)、被动观看还是由声音暗示;它对工具声音强于其他人类动作声,故不是泛泛的"动作加工"而是偏好"工具语境下的动作"。vis-aIPL 则与工具图片/命名研究(Chao and Martin, 2000;Mruczek et al., 2013)的位置一致,且已被证明独立于顶叶抓握区(人 AIP 同源区)与 IPS5——工具的抓握可供性解释不了其工具特异性;作者据此提出:偏下的 aud-aIPL 编码工具动作的动态信息,偏上的 vis-aIPL 编码工具的三维结构信息,左 aIPL 在演化中分化出至少两个调谐到不同工具侧面的子区。其二,跨模态抽象的机制排除:作者认真对待"听觉诱发的视觉表象"这一替代解释——虽然约 30% 的 V1 在听觉刺激下相对基线有激活,但 V1 明显能区分视觉类别却完全无法区分听觉类别(CPI 与 MVPA 均如此),pLS 与 ITG 这类经典表象相关区也只在单模态分类上最佳、跨模态分类不显著,故跨模态解码不能归于表象或注意差异。其三,理论对话:跨模态交叉分类被引为识别神经表征"抽象层"的手段(Kaplan et al., 2015;Man et al., 2015),与 IPL 中独立于任务与刺激细节的抽象动作表征(Chen et al., 2018)一致;IPreCS 位于腹侧前运动皮层——镜像神经元系统的核心,猴子 F5 镜像神经元本就对声音与视觉双模态响应(Kohler et al., 2002),猴 IPL 凸面 PFG 区亦有镜像特性,故人 aIPL 与猴 PFG 可能为功能对应区;结尾引 Pascual-Leone 与 Hamilton 的"metamodal 组织"假说——各区按任务需求被征用、但调谐向最可靠地计算该类信息的模态。局限方面:部分 ROI 仅在 7/8 或 6/8 被试中界定(左/右 pLS、aLS、pMTG、右 vis-aIPL),其中未在类别实验中确认特异性的区未做深入分析;DWI 的 A1 距离偏置仅以相对量部分处理;8 人的样本量靠单被试高重复设计补偿,跨被试推广的边界作者未在讨论中展开。
一句话总结
这篇论文最扎实的贡献是把"左 aIPL = 工具区"这个笼统标签拆成了两个可验证的子命题:位置上前下/后上可分,功能上一个锁在听觉域、一个跨模态成立,再配上 DWI 与功能连接两条独立证据线——单被试小样本设计在这里不是妥协而是方法自觉。按我的理解,"多感觉节点"的说法仍要留一分余地:跨模态 MVPA 证明的是体素模式携带可迁移信息,并不等于这些神经元在做感觉整合;但"任务定义计算、模态决定入口"的 metamodal 框架,确实给顶叶类工具区如何组织听觉与视觉输入提供了一个比"多感觉整合区"更克制也更可检验的图景。
审校与证据追溯 (Verification & Evidence)
图表审计结果
- Fig1: 提取质量
good,对齐度full,识别面板[] - Fig2: 提取质量
good,对齐度full,识别面板[A] - Fig3: 提取质量
good,对齐度full,识别面板[A] - Fig4: 提取质量
good,对齐度full,识别面板[A, B, C, D] - Fig5: 提取质量
good,对齐度full,识别面板[A, B, C] - Fig6: 提取质量
good,对齐度full,识别面板[A, B, C] - Fig7: 提取质量
good,对齐度full,识别面板[A, B] - Fig8: 提取质量
good,对齐度full,识别面板[A, B, C]