IT Literature Intelligence 终审版本 (VERIFIED) 论文编号:
152| 原始基线:V0_ZCODE_BASELINE| 语义审核:pass| 图表审核:pass
Deep Supervised, but Not Unsupervised, Models May Explain IT Cortical Representation
Khaligh-Razavi · PLOS Computational Biology · 2014 · Zotero itemID=1481
这篇文章把 37 个计算视觉模型——从 HMAX、VisNet 等神经科学启发模型,到 GIST、SIFT 等计算机视觉特征,再到用 120 万张标注图片训练的深度卷积神经网络——的内部表征,与人类 fMRI 和猕猴单细胞记录得到的下颞叶(inferior temporal cortex, IT)表征几何做了系统对照。它给出的核心判据是:无监督或弱监督模型都只解释了 IT 的一小部分几何结构,只有经过大规模类别标签监督训练的深度网络,再经过线性"重构"才能完全解释 IT 数据。作为"用大脑表征为计算模型排序"这一研究路线在深度学习时代的标志性工作,它不仅回答了"哪些模型像 IT",还回答了"IT 比模型多出了什么"。
研究背景
IT 皮层被认为是视觉物体识别的高层表征所在:物体图像在 IT 表征中距离越近,人在相似性判断中觉得越像,人和猴也越容易把它们混淆。此前研究已经发现,IT 的响应模式会按传统类别聚类,其中最强的分界是"有生命/无生命"(animate/inanimate),有生命内部再分出面孔和身体的子簇。也有研究尝试把少量(主要是低层的)计算模型与 IT 表征对比,比如作为 IT 模型设计的 HMAX——但 HMAX 的一个变体无法完全解释 IT 的表征几何,尤其解释不了 IT 的类别聚类。这样一来,一个悬而未决的问题是:现有的、无论出自工程还是神经科学动机的视觉模型,能否更完整地解释 IT 表征?这篇文章由此提出一个概念性判据:如果完全不借助类别边界知识的纯视觉特征就能重现 IT 的类别簇,那 IT 可以被看作纯粹的视觉表征;反之,若必须引入类别或语义信息,就应把 IT 理解为"视—语义"(visuo-semantic)表征。
另一方面,这还引出一个方法论难题:怎么公平地裁判几十个异构模型与大脑表征的吻合程度?直接用模型单元去预测脑响应(感受野建模)需要估计一个"模型单元数×脑响应数"的线性映射,对拥有上百万单元的模型来说统计代价极高。作者的策略是改用表征相似性分析(representational similarity analysis, RSA):把大脑和模型都压缩成一个表征不相似性矩阵(representational dissimilarity matrix, RDM),在"不相似性结构"这一层面比较。这样任何一个预训练好的模型都可以直接在同一个刺激集上接受检验,也使人类 fMRI、猕猴电生理与模型表征得以放进同一坐标系。
研究思路
作者的总体逻辑是一个"漏斗式"的检验序列。第一步,测试 27 个"非强监督"(not-strongly-supervised)模型表征(包括无训练的、无监督训练的、以及只用 884 张图弱监督训练的两个模型),看它们与 IT 的 RDM 相关有多高、能否达到噪声天花板、类别聚类强度与 IT 差多少。第二步,既然这些模型"不像 IT",就要追问缺的是什么:是特征齐全但比例不对(那重新加权应可补救),还是本质特征缺失(那线性重组也无济于事)。第三步,测试强监督的深度卷积网络(AlexNet,Krizhevsky et al. 2012,用 120 万张 ImageNet 标注图片训练):它是否比所有非强监督模型更接近 IT?逐层上升时与 IT 的相似度如何变化?第四步,若仍不到位,就用线性监督判别(SVM)对深层特征做"重混"(remixing)以强化关键类别分界,再对各层加权(reweighting),构造一个"IT-几何监督"模型,看能否补齐最后的差距。第五步,反过来验证一个正相关假设:越像 IT 的模型是否分类性能越好——用这个双向关系把"解释大脑"与"工程性能"两条标准挂钩。所有训练、重混、加权所用的图像都与测脑数据的 96 张刺激完全不重叠,避免了循环论证。
方法
脑数据用的是此前发表的同一套 96 张彩色孤立物体图像(一半有生命、一半无生命;有生命下分人/动物面孔与人/动物身体,无生命下分自然/人造物)。人 IT 数据来自 Kriegeskorte 等 2008 年的 fMRI 实验:4 名被试共 8 个 session,刺激以 2.9 度视角呈现在中央凹(文章因此没法区分 V1/V2/V3,只能定义早期视觉皮层 EVC 这个 ROI),呈现 300 ms,并用注视任务抑制眼动;另外还有 LOC、FFA、PPA 等 ROI 可供对照。猴 IT 数据来自 Kiani 等 2007 年的单细胞记录(两只猴,刺激呈现 105 ms,只有 92 张刺激有数据,比较时用 NaN 补齐并忽略)。对每个脑区或模型表征,计算 96×96 的 RDM,矩阵元素为 1 减去两个刺激响应模式之间的 Pearson 相关。模型与脑 RDM 之间用 Kendall τA 秩相关评分;显著性用刺激标签随机置换检验(10,000 次)和刺激集 bootstrap 评估;对人 IT 还估算了噪声天花板(noise ceiling,即给定数据噪声水平后"真模型"预期能达到的相关区间)。
类别聚类强度用"类别性指数"(categoricality index)量化:把 10 个类别簇 RDM(animate、inanimate、face、human face、non-human face、body、human body、non-human body、natural 及 artificial inanimate)线性拟合到每个 RDM 上,取拟合模型与该 RDM 的相关平方;为使模型与脑数据可比,先向模型表征加噪,使其噪声水平与人 IT 一致。"重混"指在模型特征上训练三个线性支持向量机(animate/inanimate、face/nonface、body/nonbody),用其 decision value 作为新特征;"重加权"用非负最小二乘在 RDM 层面给各模型/各层分配权重,且以交叉验证(每次留出 8 张图)防止对图像集过拟合。深度网络共 8 层(5 个卷积层 + 3 个全连接层),取各层激活构造 RDM;combi27 则是把 27 个非强监督模型各取前 95 个主成分后拼接而成。
主要结果
- 非强监督模型只解释 IT 的一小部分几何:与 hIT 的 τA 相关全部不超过 0.17,与 mIT 不超过 0.26(图 1、图 2,表 1)。把 27 个模型特征拼接的 combi27 表现最好(hIT 0.17、mIT 0.25),且显著优于单模型;单个模型中 HMAX 各阶段与 IT 最接近。模型对 mIT 的解释普遍好于对 hIT(p=0.001),作者归因于电生理数据噪声更小。
- 没有一个非强监督模型达到噪声天花板:hIT 噪声天花板下界为 0.26,combi27 的 0.17 与之相距甚远(图 2A);mIT 因只有两只猴无法估计天花板。这说明 fMRI 数据中含有一段所有这些模型都未捕捉的 IT 表征成分。
- IT 比所有非强监督模型更"类别化":hIT 的类别性指数约为 0.4,而 28 个模型全部低于 0.16(多数低于 0.1),差值经 bootstrap 推断显著(图 3、图 4)。模型能聚出"人脸"簇(源于这些人脸照片本身视觉相似),但聚不出跨物种的"面孔"簇,也没有清晰的 animate/inanimate 分界——说明 IT 的类别结构不只是视觉相似性的自然结果。
- 对非强监督特征做重混与重加权仍然失败:用 884 张独立训练图在 combi27 特征上训练的三个 SVM 判别量与 IT 的相关很低(τA<0.1),重加权的组合模型(交叉验证后)τA 仅 0.13(hIT)/0.20(mIT),甚至略差于 combi27(图 5)——暗示这些模型缺的不是权重比例,而是 IT 所需的关键特征。
- 强监督深度网络明显更接近 IT,但仍不达标:改为'显著优于 combi27(hIT,p<0.05;mIT 上 0.29 vs 0.25 的差异不显著)';自第 1 层到第 7 层与 IT 的相关大致单调上升,而最后一层 softmax 读出层(layer 8)反而回落到 0.13/0.18;即便最好的层也未触及噪声天花板(图 6、图 7)。类别结构分析显示各层确实"长出"了一些类别分块,但侧重与 IT 不同:layer 7 更强调人脸/动物脸、人造/自然物之分,IT 则更强调 animate/inanimate 与面孔/身体之分(图 8、图 9)。
- "重混+重加权"后的 IT-几何监督深层模型完全解释了 IT:把 layer 7 上三个 SVM 判别量与八个层一起按非负权重组合,交叉验证后与 hIT、mIT 的 τA 分别达 0.38 和 0.40,落在噪声天花板区间之内,类别性指数也不再显著低于 IT(图 7–图 10)。这是全文惟一"达标"的表征。
- 越像 IT 的模型分类越好:对 96 张刺激做 12 折交叉验证的 animate/inanimate 线性 SVM 分类,convnet layer 7 最高(96%),combi27 次之(76%)(图 11)。模型与 IT 的 RDM 相关能预测其分类正确率(hIT r=0.75,mIT r=0.68),且类内几何的相似度同样有预测力(r=0.45 / 0.67)(图 12)。其他脑区方面:Gabor 类低层模型解释 EVC 且达到其噪声天花板;layer 6 达到 FFA 的天花板;PPA 仅 combi27 有显著相关(0.034),作者推测与刺激集缺少大物体和场景图像有关。
图注解读
图 1 · 与 IT 最相似的七个非强监督模型 RDM
原文图注:Figure 1. Representational dissimilarity matrices for IT and for the seven best-fitting not-strongly-supervised models. The IT RDMs (black frames) for human (A) and monkey (B) and the seven most highly correlated model RDMs (excluding the representations in the strongly supervised deep convolutional network). The model RDMs are ordered from left to right and top to bottom by their correlation with the respective IT RDM. These are the seven most higly correlated RDMs among the 27 models that were not strongly supervised and their combination model (combi27). The number below each RDM is the Kendall tA correlation coefficient between the model RDM and the respective IT RDM. All correlations are statistically significant.
读法:A、B 两行分别是人 IT 与猴 IT 的 RDM(黑框标出),旁边按相关高低排列七个最接近的非强监督模型 RDM;每个矩阵都是 96×96 的对称热图,越亮/越暗的格子代表两个刺激的响应模式越相似/越不相似(具体配色见原图),矩阵对角块对应的刺激类别若聚成一簇,会呈现方块状结构。矩阵下方标注该模型与 IT 的 τA 相关。与 IT 相比,这些模型 RDM 里能看出"人脸"小块(人脸照片本身视觉相近),但人与动物面孔没有聚成一簇、无生命物体也较分散——这正是结果 1、3 的直观呈现。
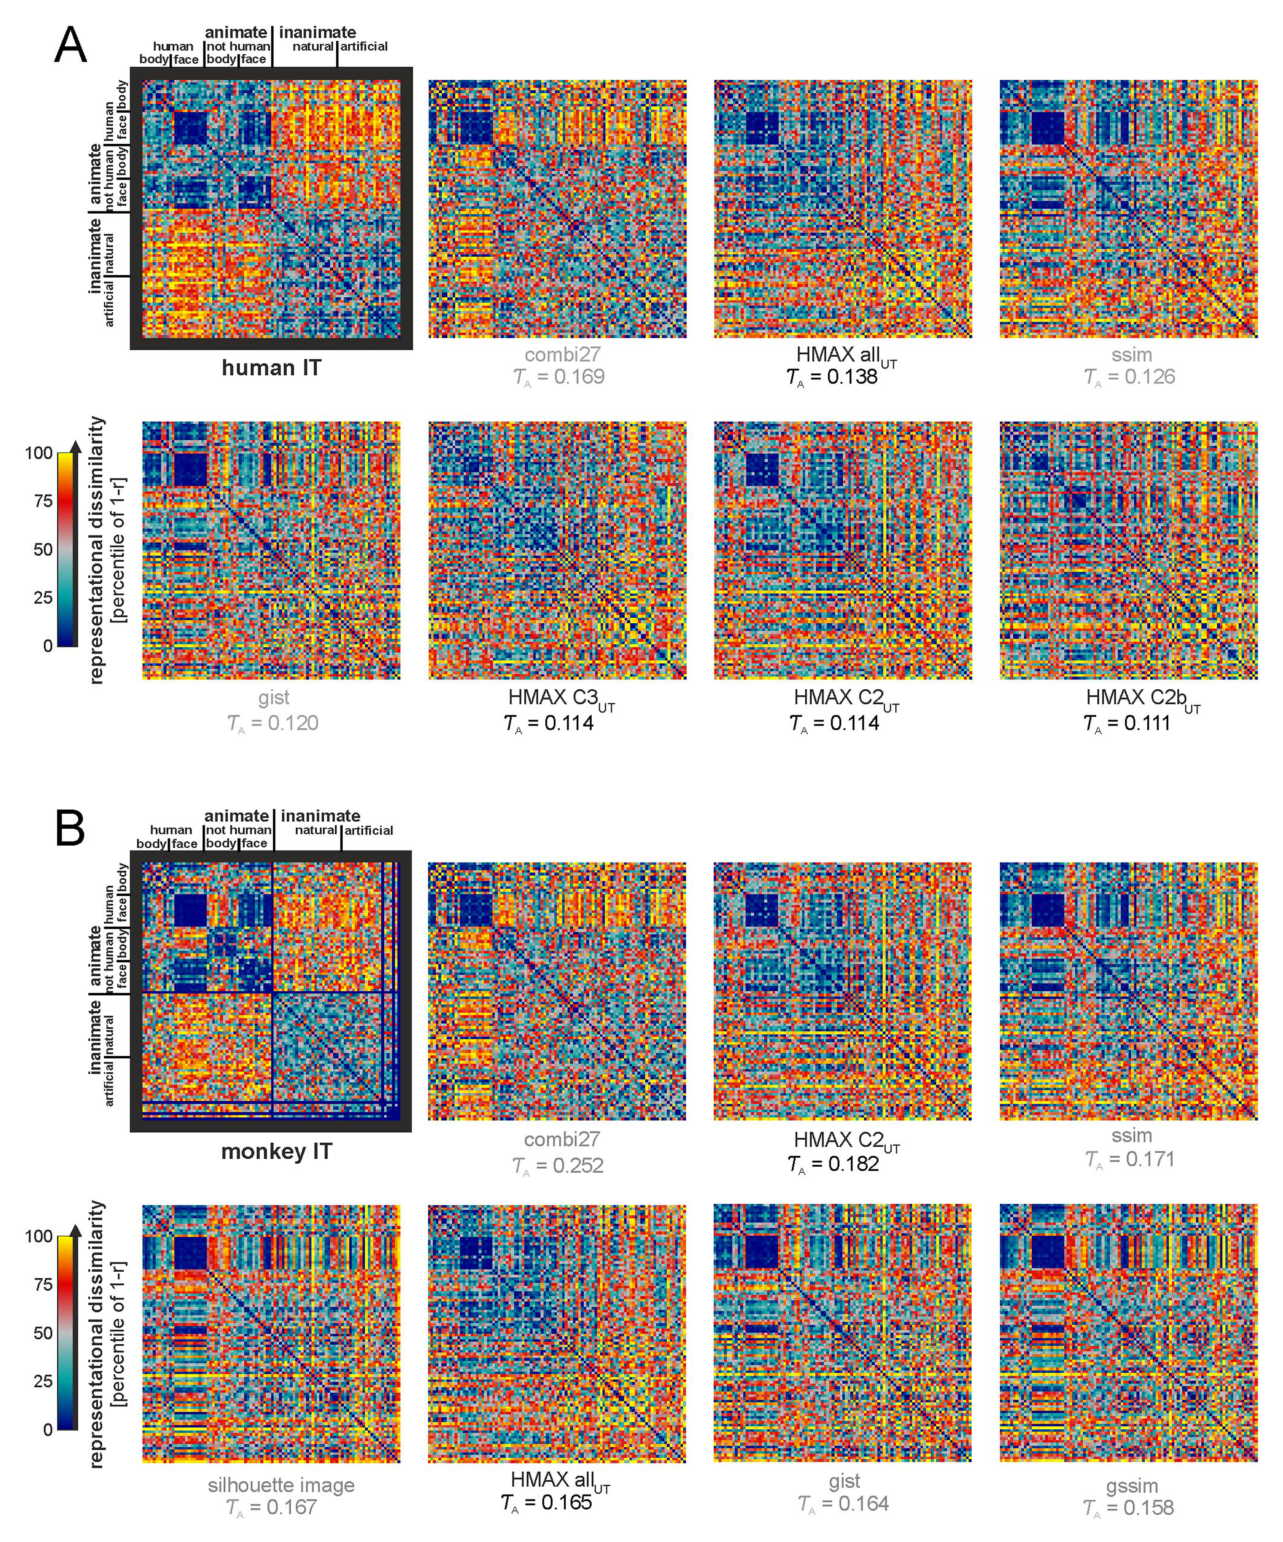
图 2 · 非强监督模型与 IT 的相关均低于噪声天花板
原文图注:Figure 2. The not-strongly-supervised models fail to fully explain the IT data. The bars show the Kendall-tA RDM correlations between the not-strongly-supervised models and IT for human (A) and monkey (B). The error bars are standard errors of the mean estimated by bootstrap resampling of the stimuli. Asterisks indicate significant RDM correlations (random permutation test based on 10,000 randomizations of the stimulus labels; ns: not significant, p,0.05: , p,0.01: , p,0.001: , p,0.0001: **). The noise ceiling (gray bar) indicates the expected correlation of the true model (given the noise in the data). None of the not-strongly-supervised models reaches the noise ceiling.
读法:横轴是各模型(带 UT 上标为无监督训练、ST 为监督训练、无上标为不训练;黑色字体为生物学启发模型、灰色为计算机视觉模型),纵轴为与人 IT(A)/猴 IT(B)的 τA 相关,误差棒为刺激集 bootstrap 的标准误,星号是置换检验显著性。灰色横条是 hIT 噪声天花板(上下界),读者可以直观看到所有柱子都明显低于它——支撑结果 1、2。mIT 无天花板(只有两只猴)。
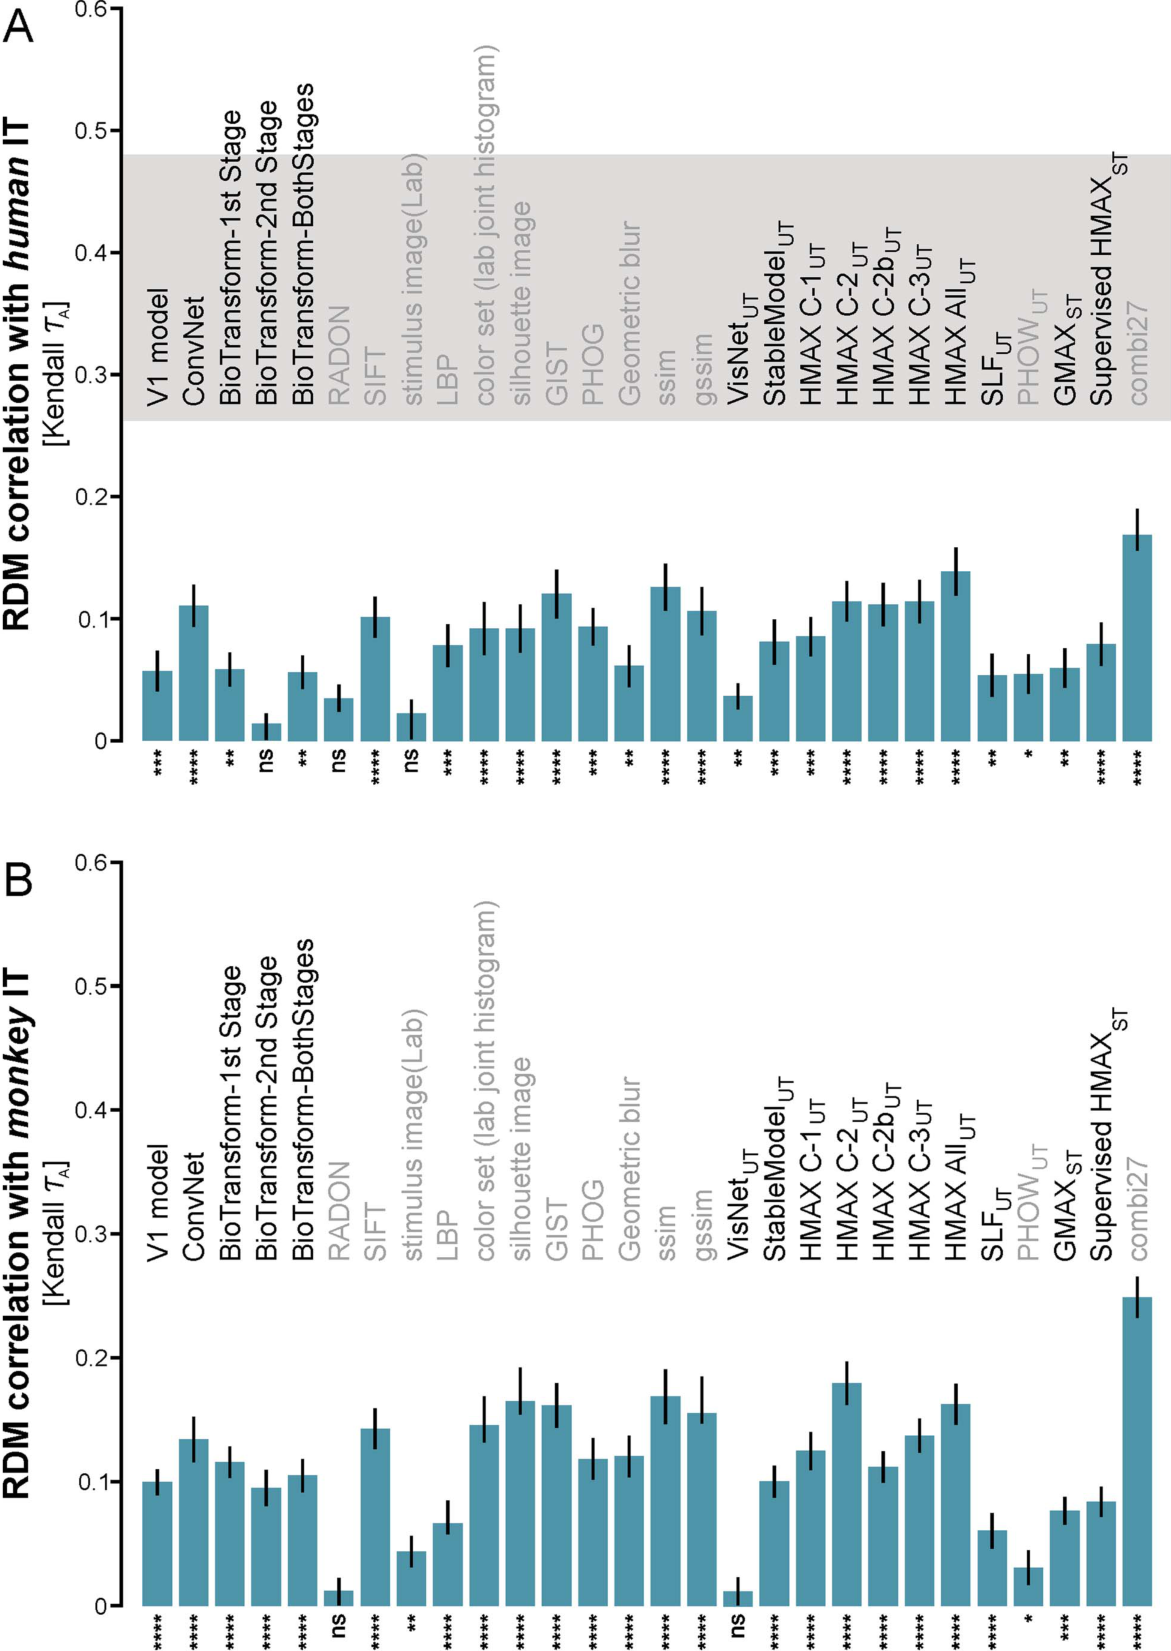
图 3 · 非强监督模型中看不见 IT 式的类别结构
原文图注:Figure 3. IT-like categorical structure is not apparent in any of the not-strongly-supervised models. Brain and model RDMs are shown in the left columns of each panel. We used a linear combination of category-cluster RDMs (Figure S5) to model the categorical structure (least-squares fit). The categories modeled were animate, inanimate, face, human face, non-human face, body, human body, non-human body, natural inanimates, and artificial inanimates. The fitted linear-combination of category-cluster RDMs is shown in the middle columns. This descriptive visualization shows to what extent different categorical divisions are prominent in each RDM. The residual RDMs of the fits are shown in the right column.
读法:每个面板三列依次为原始 RDM、用 10 个类别簇 RDM 最小二乘拟合出的"类别成分"、以及拟合残差——中列把每个 RDM 里"类别可解释的部分"可视化,残差则是类别模型解释不掉的部分。对比中列即可看出:模型里"人脸"簇明显、"有生命/无生命"大分界很弱,而人、猴 IT 的中列都有强的人/动物面孔簇与无生命簇。此为描述性结果,统计推断见图 4。
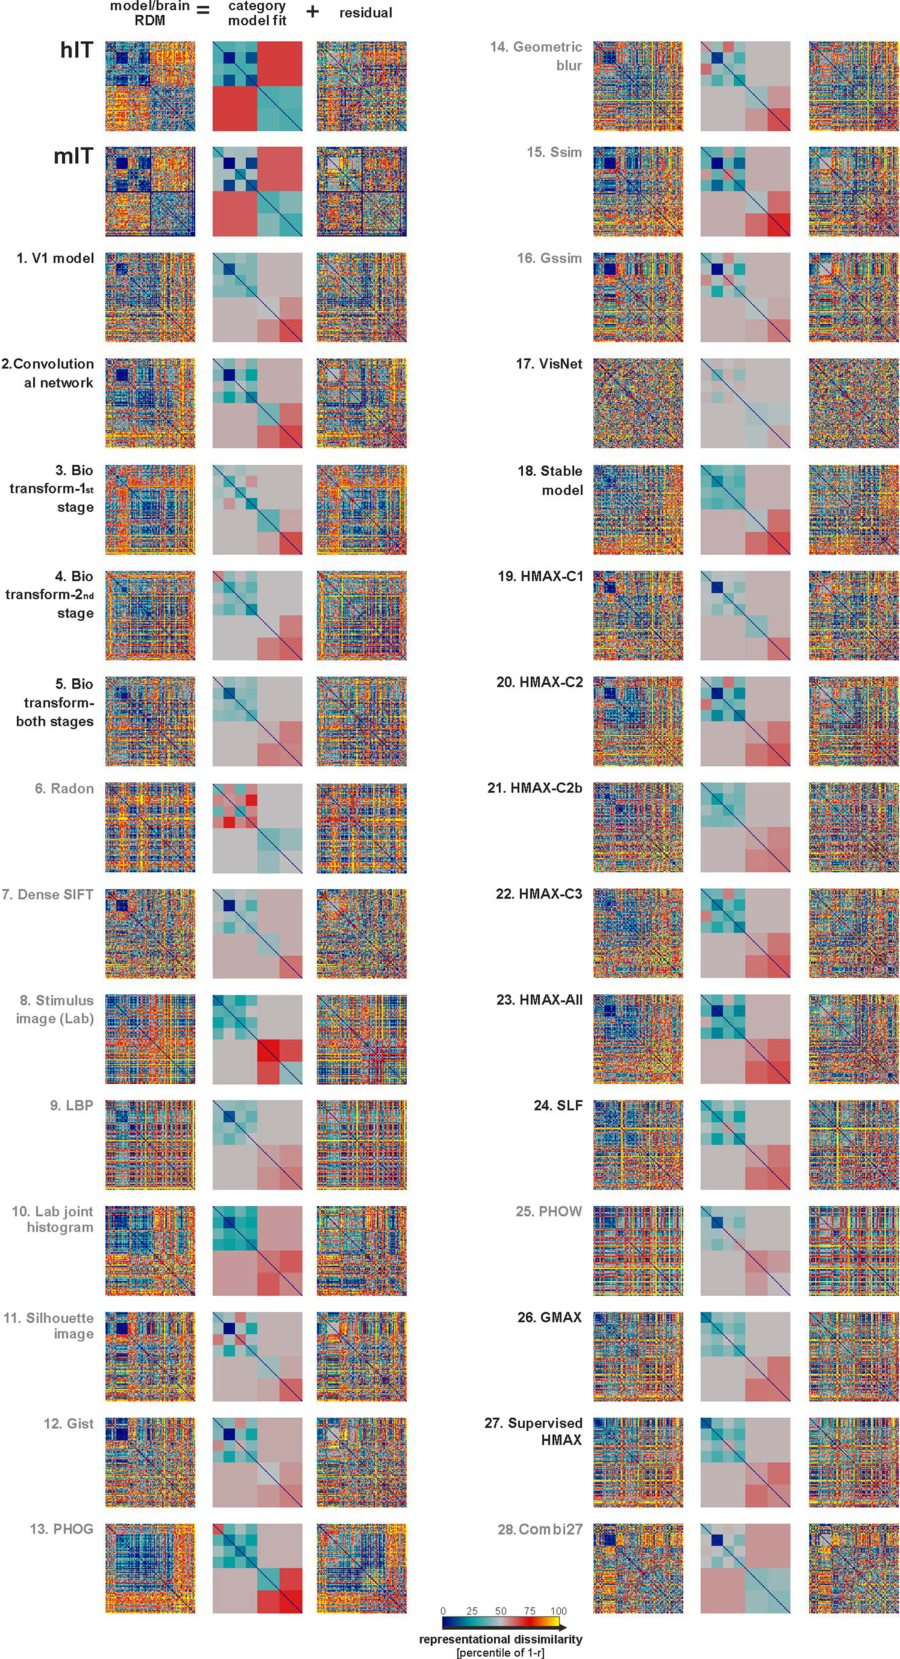
图 4 · IT 的类别性指数显著高于全部非强监督模型
原文图注:Figure 4. The not-strongly-supervised models are less categorical than IT. Categoricality was measured using a categoricality index (vertical axis) for each model and brain RDM. The categoricality index is defined as the proportion of RDM variance explained by the category-cluster model (Figure S5), i.e. the squared correlation between the fitted category-cluster model and the RDM it is fitted to. The blue (gray) line shows the categoricality index for hIT (mIT). Significant differences between the categoricality indices of each model and hIT are indicated by blue vertical arrows. Categoricality is significantly greater in hIT and mIT than in any of the 28 models.
读法:纵轴是类别性指数(拟合类别簇 RDM 与该 RDM 相关的平方,即类别结构解释的方差比例),横轴各模型;蓝/灰横线及阴影分别是 hIT/mIT 的指数与 95% 置信区间(分析前已把模型噪声水平调到与 hIT 相同以保证可比),蓝色/灰色竖箭头标记与 hIT/mIT 差异显著的模型。hIT 约 0.4,模型全部 <0.16:这就是结果 3 的统计版本。
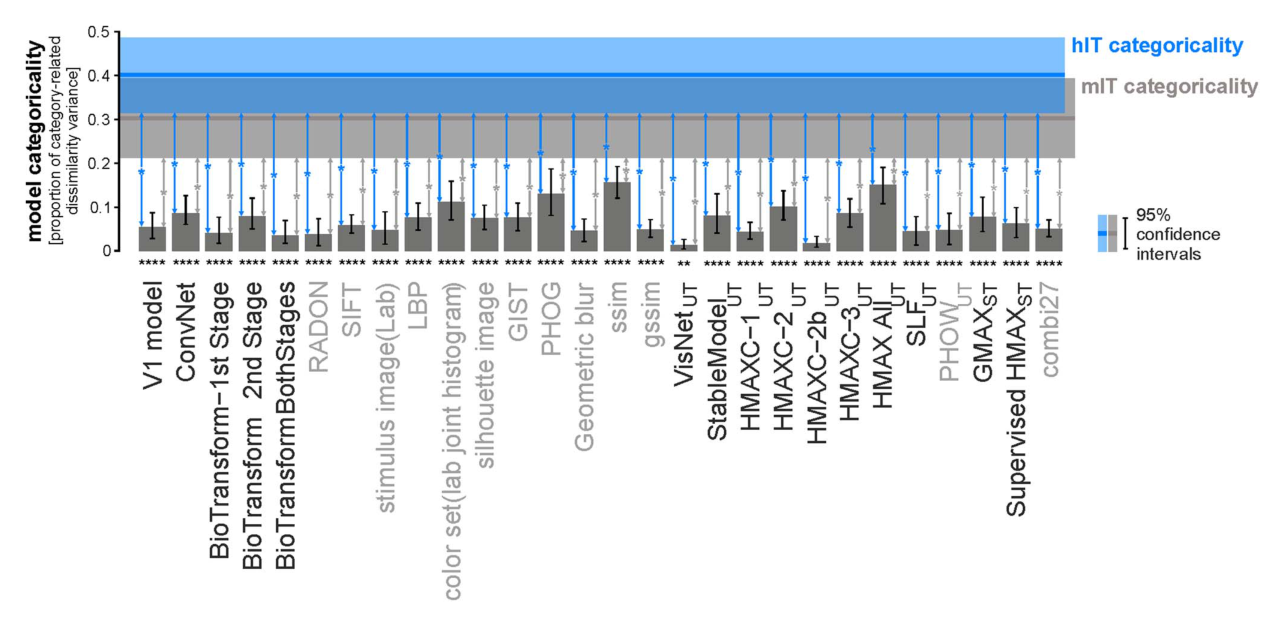
图 5 · 重混与重加权救不了非强监督模型
原文图注:Figure 5. Remixing and reweighting features of the not-strongly supervised models does not explain IT. In order to build an IT-like representation, we attempted to remix the features to strengthen relevant categorical divisions. We trained three linear SVM classifiers (for animate/inanimate, face/nonface, and body/nonbody) on the combi27 features using 884 training images (separate from the set we had brain data for).
读法:最上一行是三个 SVM decision value 构成的单特征 RDM(与 hIT/mIT 的 τA 很低,<0.1),说明从 combi27 里读不出干净的类别判别面;中间行是 31 个非负权重的拟合结果;底行中间是交叉验证得到的"IT-几何监督 combi27" RDM,与左右两侧的 hIT/mIT 对比,类别方块结构仍然缺失,τA 仅 0.13(hIT)/0.20(mIT)。此图支撑结果 4:问题不在权重比例,而在特征本身。
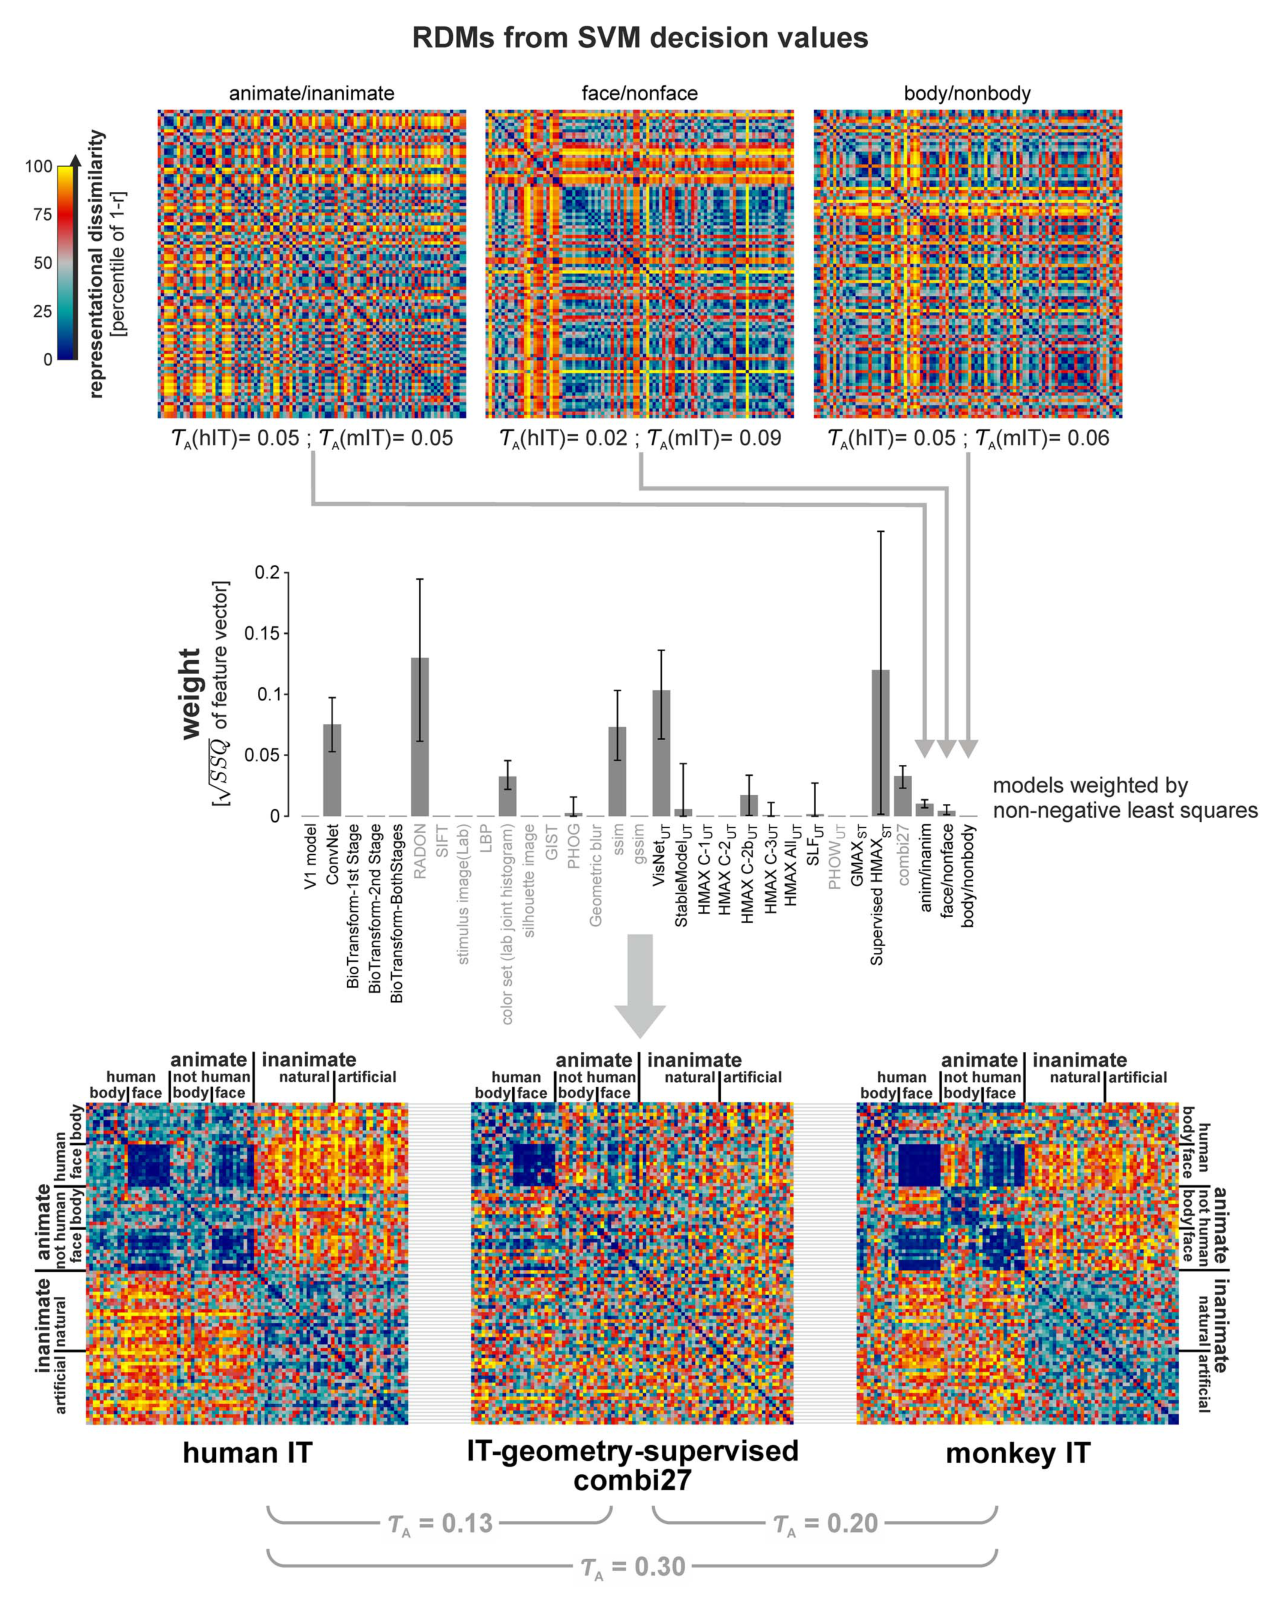
图 6 · 深度监督网络各层的 RDM 及其与 IT 的相关
原文图注:Figure 6. RDMs of all layers of the strongly supervised deep convolutional network. RDMs for all layers of the deep convolutional network (Krizhevsky et al. 2012) ref [41] are shown for the set of the 96 images (L1: layer 1 to L7: layer 7). Kendall-tA RDM correlations of the models with hIT and mIT are stated underneath each RDM. All correlations are statistically significant.
读法:从 L1 到 L7 各层对同一 96 图刺激集算出的 RDM 排成一排,矩阵下方给出与 hIT、mIT 的 τA(均显著)。纵向查看可以发现随层数增加,RDM 中类似 IT 的结构(如 animate/inanimate 大块)逐渐显现,相关数字也随之上升——为图 7 的定量比较做铺垫。
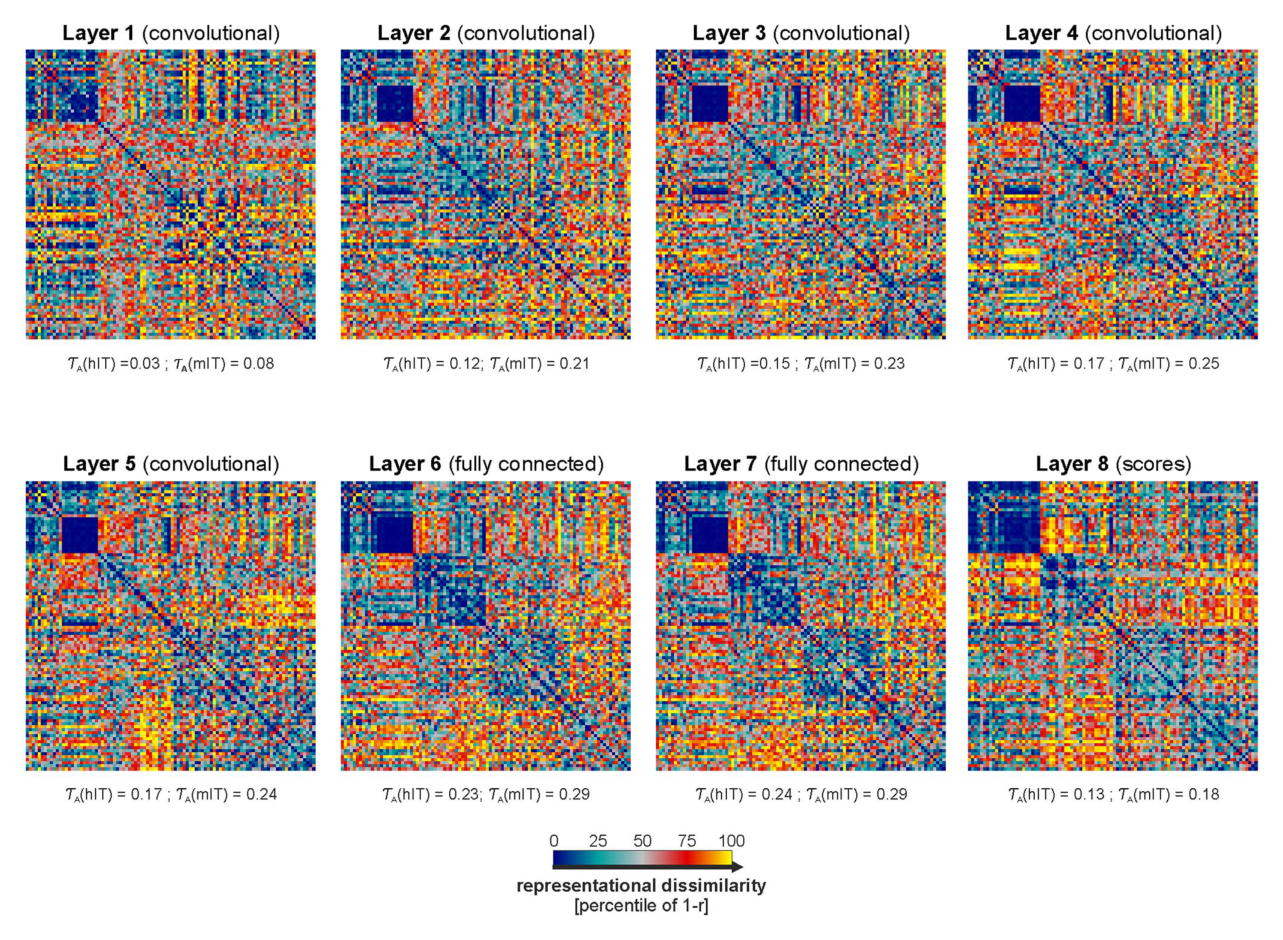
图 7 · 各层与 hIT 的相关随深度上升,最终 IT-几何监督模型触及天花板
原文图注:Figure 7. The strongly supervised deep network, with features remixed and reweighted, fully explains the IT data. The bars show the Kendall-tA RDM correlations between the layers of the strongly supervised deep convolutional network and human IT. As we ascend the layers of the deep network, model RDMs explain increasing proportions of the variance of the hIT RDM. The noise ceiling (gray bar) indicates the expected correlation of the true model (given the noise in the data). None of the layers of the deep network reaches the noise ceiling. However, the final fully connected layers 6 and 7 come close to the ceiling. Remixing the features of layer 7 using linear SVMs to strengthen the categorical divisions provides a representation composed of three discriminants (animate/inanimate, face/nonface, and body/nonbody) that reaches the noise ceiling. Reweighting the model layers and the three discriminants yields a representation that explains the hIT geometry even better.
读法:横轴从 L1 到 L7 再到三个 SVM 判别量和最终组合模型,纵轴为与 hIT 的 τA;柱顶星号为置换检验显著性,柱间横线标记成对比较显著(bootstrap,FDR 0.05);灰色横条是噪声天花板。L6、L7 接近但未达天花板,改为'由三个 SVM 判别量组成的重混表征触及噪声天花板',或按图 7 实际柱高与天花板灰条的相对位置核实后再表述,而重加权后的 IT-geometry-supervised 模型(τA=0.38)明确高于其他所有柱子并落在天花板区间内——结果 5、6 的关键证据。
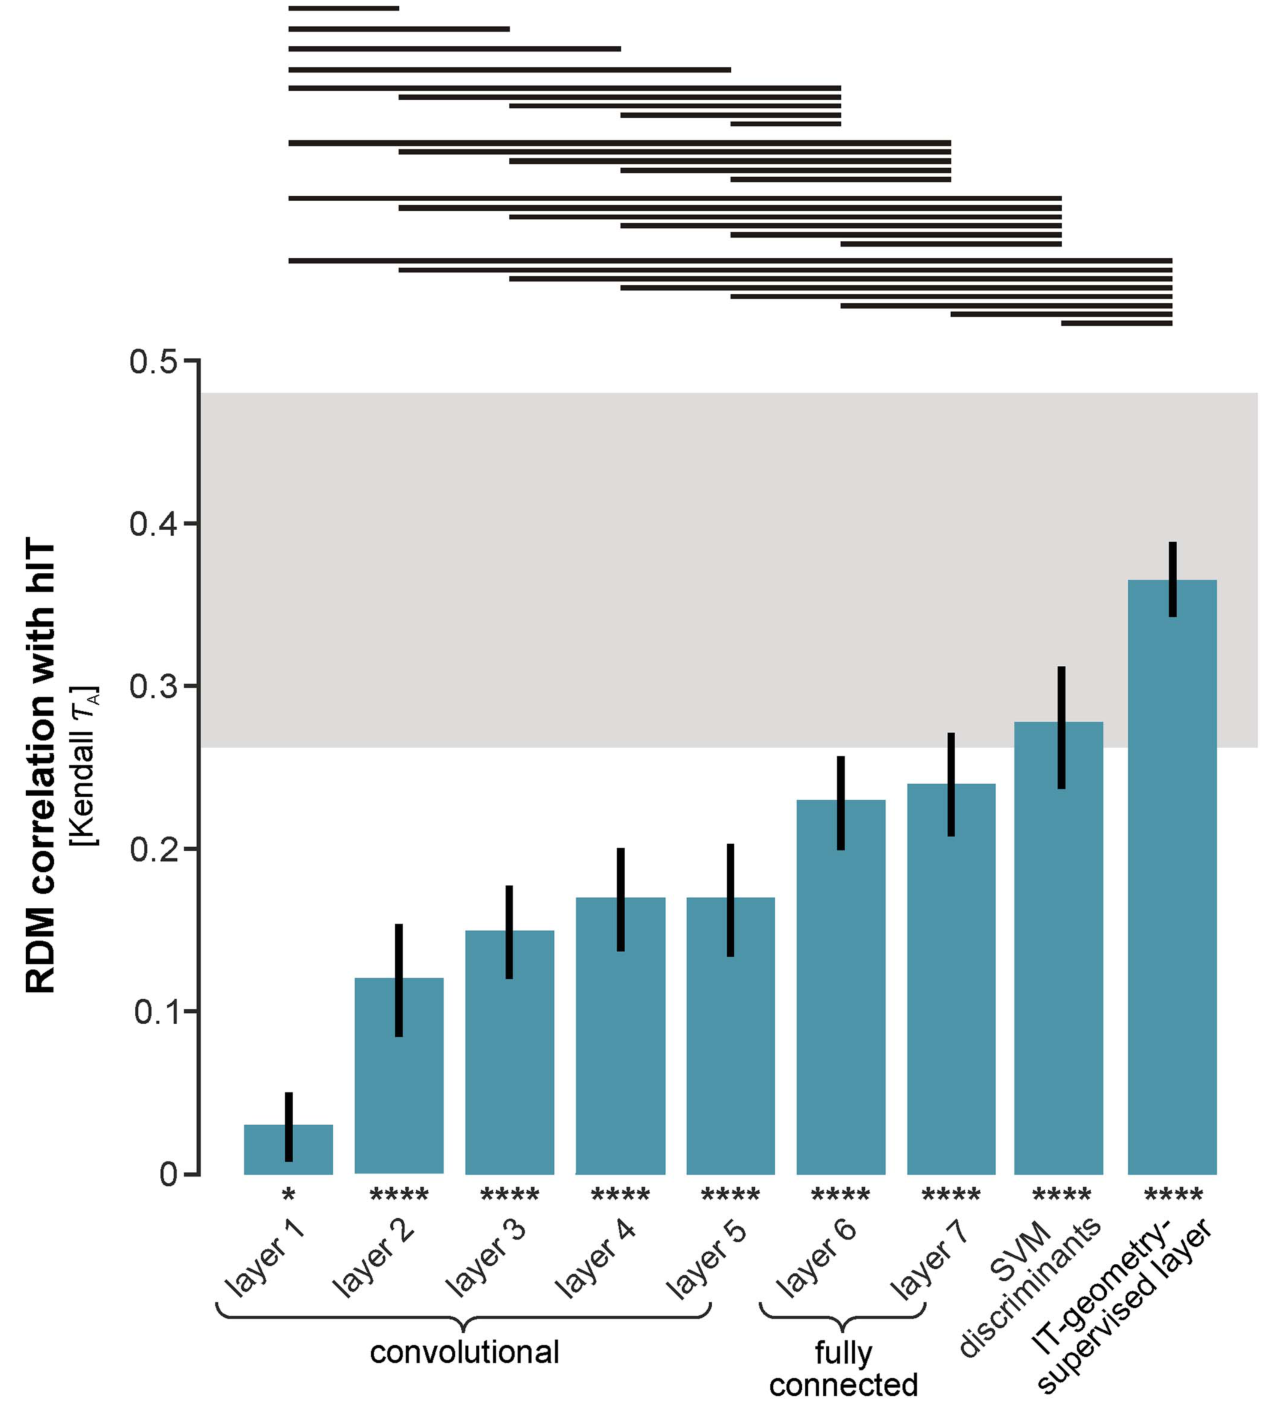
图 8 · 类别结构沿深层网络逐层浮现,重混后与 IT 相似
原文图注:Figure 8. IT-like categorical structure emerges across the layers of the deep supervised model, culminating in the IT-geometry-supervised layer. Descriptive category-clustering analysis as in Figure 3, but for the deep supervised network. The fitted linear-combination of category-cluster RDMs is shown in the middle columns. This descriptive visualization shows to what extent different categorical divisions are prominent in each layer of the deep supervised model. The layers show some of the categorical divisions emerging. However, remixing of the features (linear SVM readout) is required to emphasize the categorical divisions to a degree that is similar to IT. The final IT-geometry-supervised layer (weighted combination of layers and SVM discriminants) has a categorical structure that is very similar to IT.
读法:与图 3 同样的三列式呈现,只是对象换成深度网络的各层与最终的 IT-geometry-supervised 层。可见较深的层已有若干类别分块雏形,但强调的分界与 IT 不完全一致(如层间对人脸/动物脸、人造/自然之分更强,对 animate/inanimate、面孔/身体之分更弱);只有经过 SVM 重混后再加权的最终层,其中列格局才与 IT 高度相似。
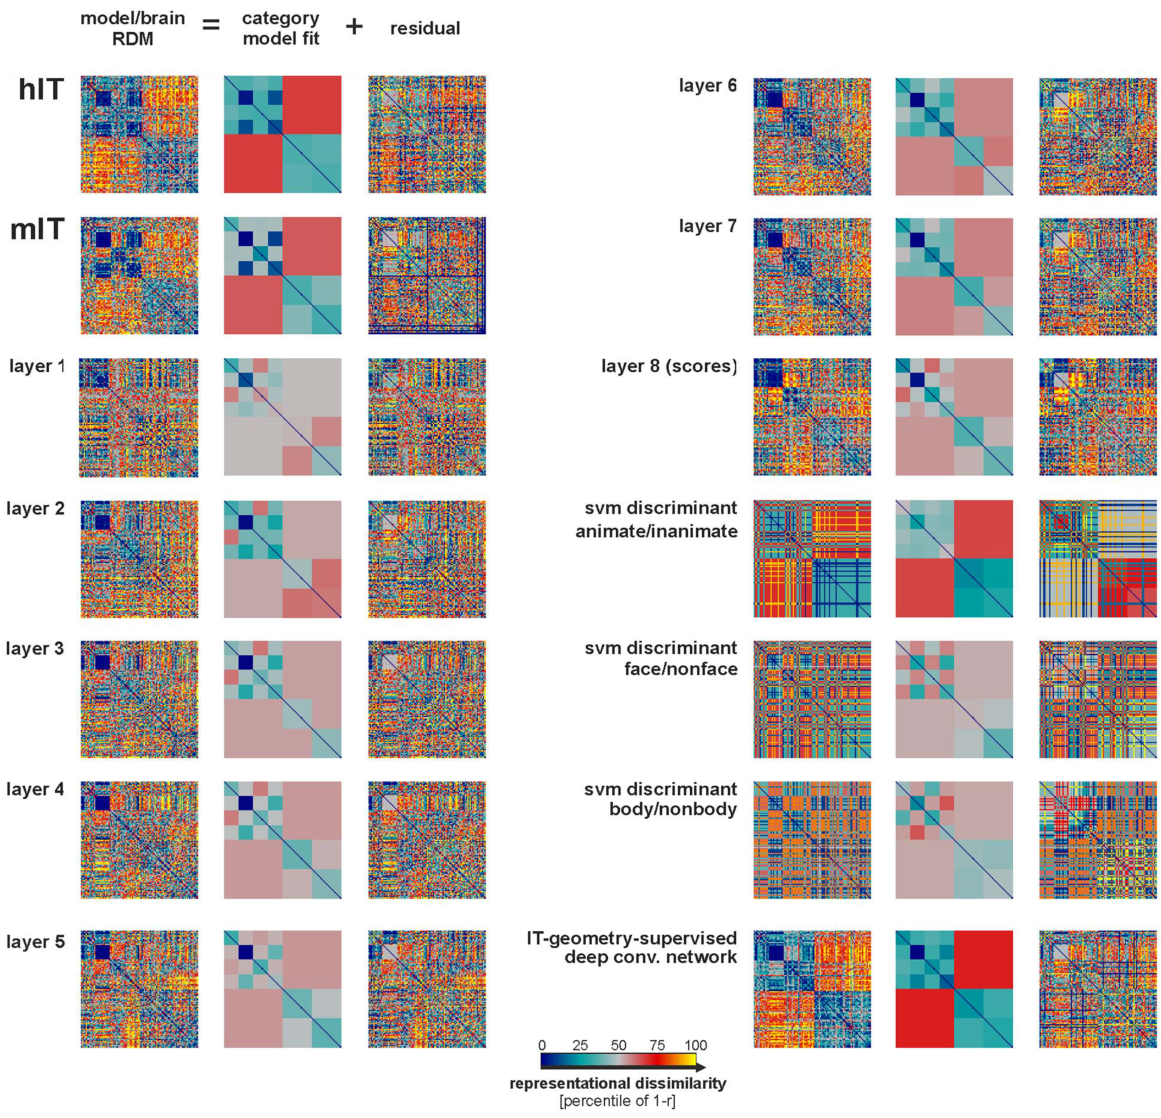
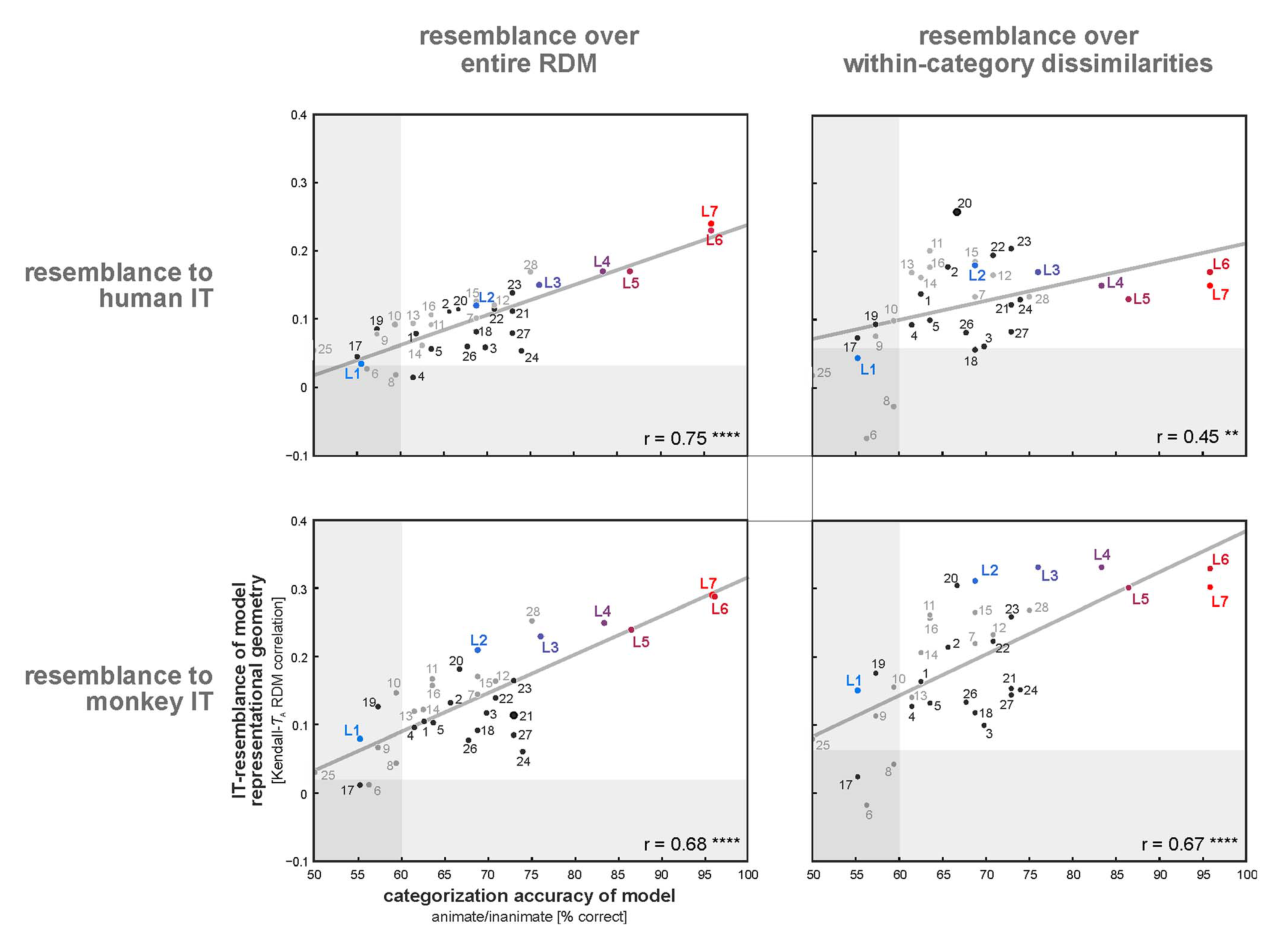
图 9 · 深层网络内部各层类别性仍不及 IT,重混加权后追平
原文图注:Figure 9. The layers of the deep supervised model are less categorical than IT, but remixing and reweighting achieves IT-level categoricality. Bars show the categoricality index for each layer of the deep convolutional network and for the IT-geometry-supervised layer. Categoricality is significantly greater in hIT and mIT than in any of the internal layers of the deep convolutional network. However, the IT-geometry-supervised layer (remixed and reweighted) achieves a categoricality similar to (and not significantly different from) IT.
读法:横轴为 L1–L8 及 IT-geometry-supervised 层,纵轴为类别性指数,蓝/灰阴影为 hIT/mIT 的置信区间,竖箭头标 Bonferroni 校正后的显著差异。所有内部层(含读出层 L8)都显著低于 IT,惟有最终组合层与 IT 不再有显著差异——结果 6 的第二个支点。
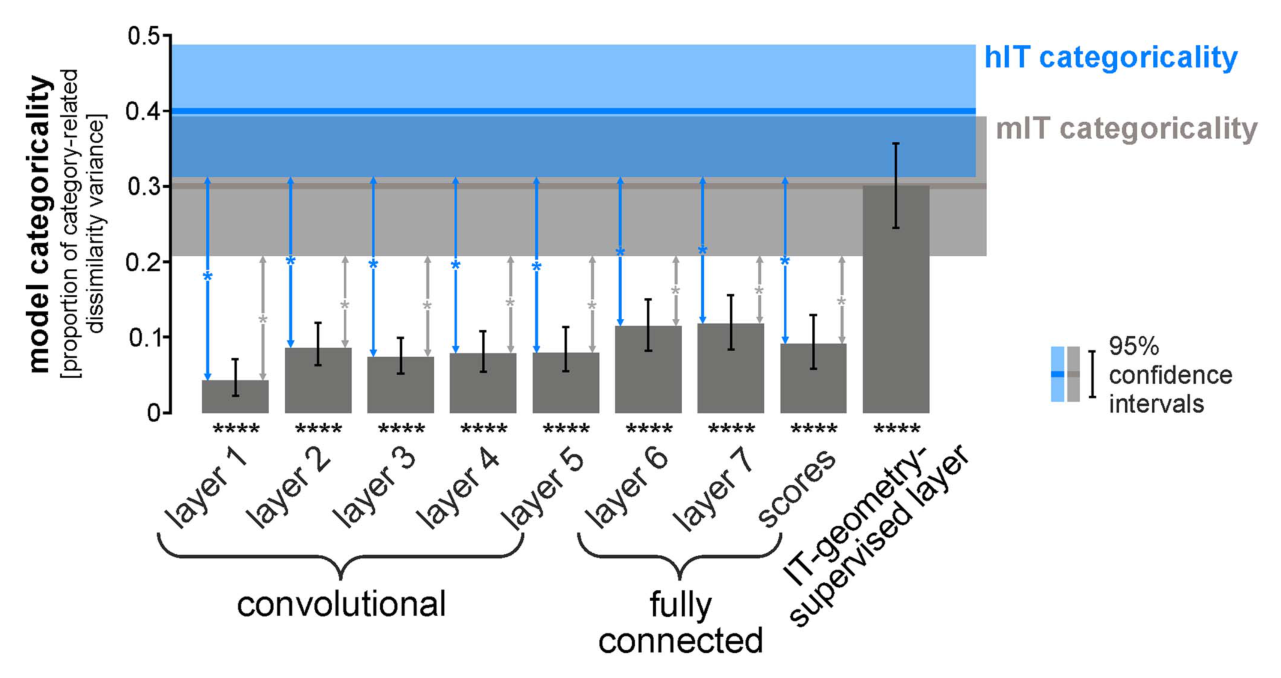
图 10 · 对深层特征重混加权,得到与 IT 几何一致的 RDM
原文图注:Figure 10. Remixing and reweighting features of the deep supervised network achieves an IT-like representational geometry. All analyses and conventions here are analogous to Figure 5, but applied to the strongly supervised deep convolutional network. Remixing the features of layer 7 by fitting linear SVMs (separate set of training images) for the major categorical divisions (animate/inanimate, face/nonface, and body/nonbody) helped account for the categorical clusters in IT. The tA RDM correlation between the fitted model and IT is about equal for monkey IT (0.40) and human IT (0.38).
读法:结构与图 5 平行:顶行是 layer 7 上三个 SVM 判别量的 RDM(这次有很强的类别方块,因为 layer 7 分类性能好),中行为 11 个权重(8 层 + 3 判别量)的非负拟合值,底行中央为交叉验证后的最终 RDM,与 hIT、mIT 并排对比,肉眼已很接近;τA 分别为 0.38(hIT)、0.40(mIT),甚至高于 hIT 与 mIT 彼此之间的相关。这是"完全解释 IT 数据"主张的直接证据。
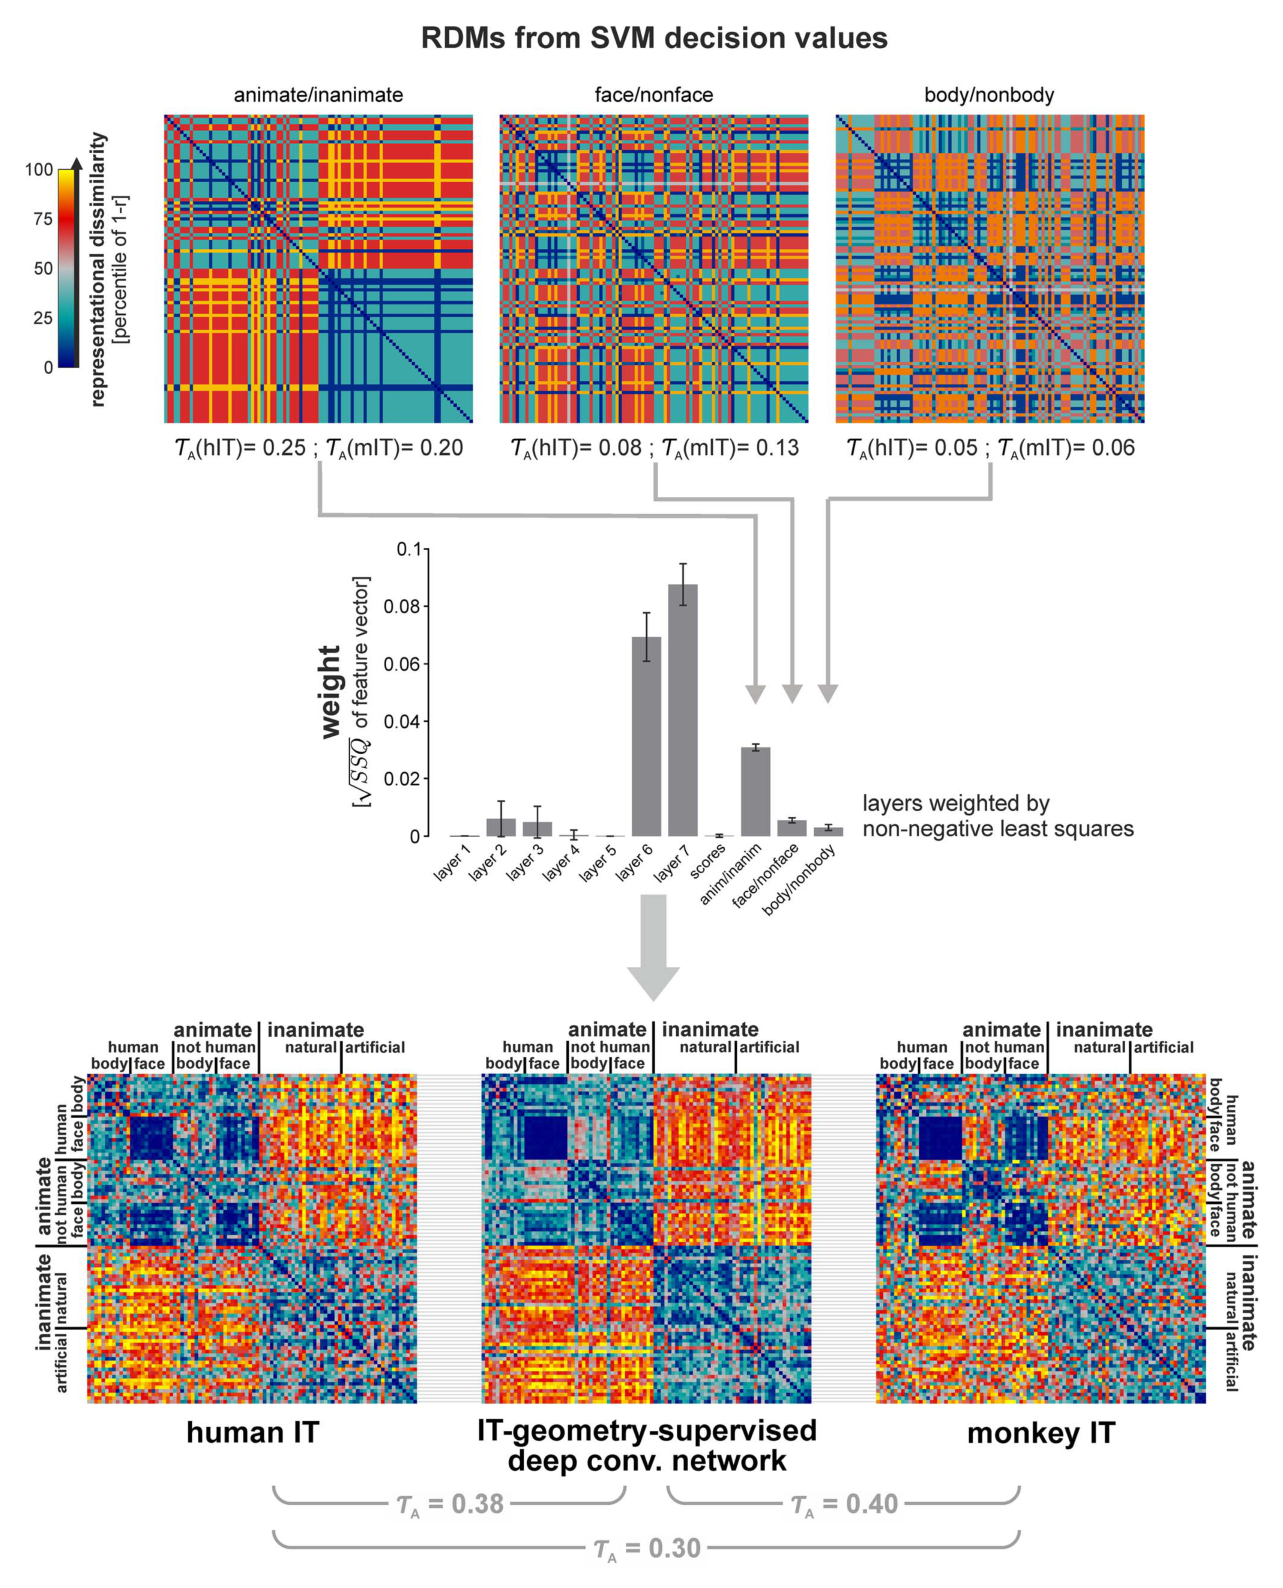
图 11 · 各模型 animate/inanimate 分类性能
原文图注:Figure 11. Animate/inanimate categorization accuracy for all models. Each dark blue bar shows the categorization accuracy of a linear SVM applied to one of the computational model representations. Categorization accuracy for each model was estimated by 12-fold crossvalidation on the 96 stimuli. Light blue bars show the average model categorization accuracy for random label permutations. The deep convolutional network model (final fully connected layer 7) has the highest animate/inanimate categorization performance (96%). The combi27 has the second highest performance (76%).
读法:横轴为各模型,纵轴为线性 SVM 在 96 张刺激上 12 折交叉验证的 animate/inanimate 分类正确率;深蓝柱是真实标签下的正确率,浅蓝柱是标签随机置换后的平均水平(≈机会线),星号标记显著高于机会。convnet layer 7 的 96% 远超其余,combi27 为 76%——说明强监督特征不仅更像 IT,也在工程标准上领先。
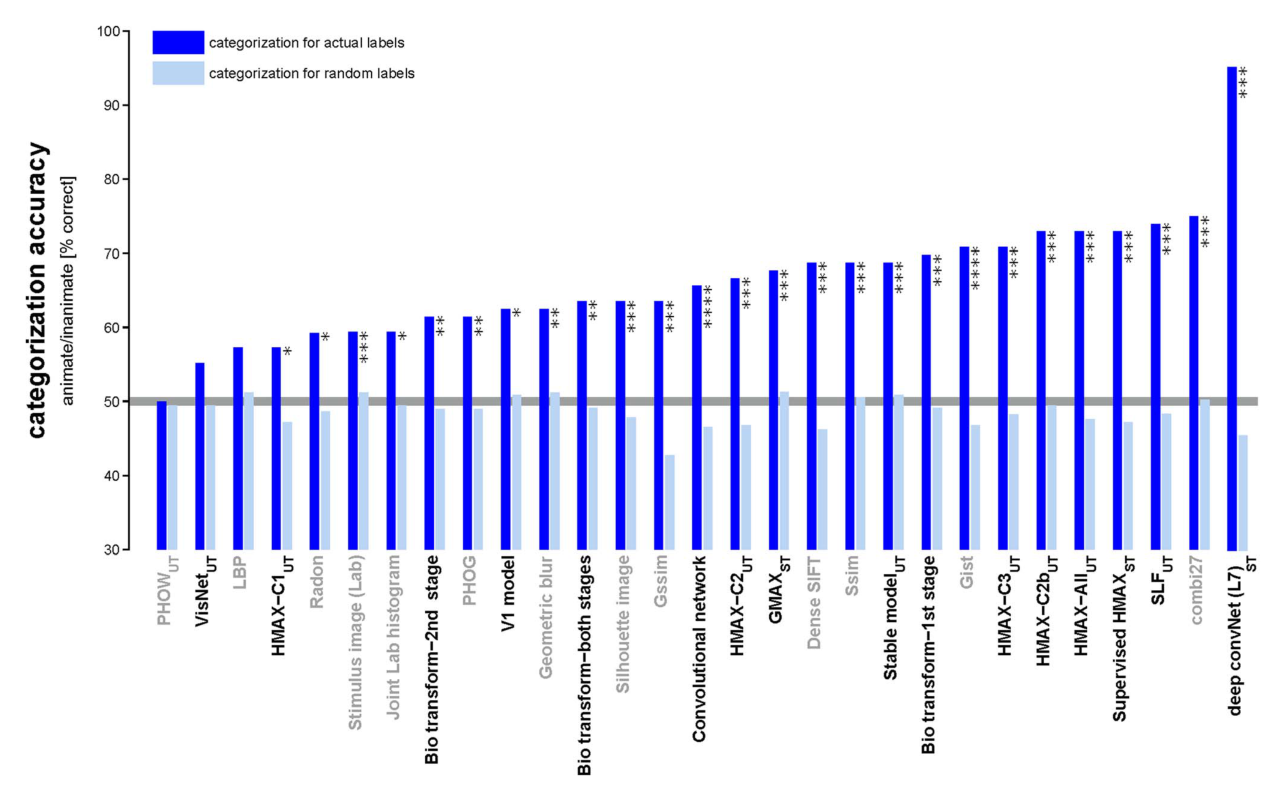
图 12 · 模型越像 IT,分类性能越好
原文图注:Figure 12. Model representations resembling IT afford better categorization accuracy. A model's IT-resemblance (measured by the RDM correlation between IT and model) predicts its categorization accuracy (animate/inanimate). This holds for both human-IT resemblance (top) and monkey-IT resemblance (bottom). However, the within-category RDM correlation between a model and IT also predicts model categorization accuracy. Each panel shows the least-squares fit (gray line) and the Spearman rank correlation r. Each circle shows one of the models. Computer vision models are shown by gray circles; biologically motivated models are shown by black circles. The transparent horizontal and vertical rectangles cover non-significant ranges along each axis.
读法:左列两张散点图横轴为模型与 hIT/mIT 的 RDM 相关、纵轴为分类正确率;右列把横轴换成"类内不相似性相关"(只看 animate 内部与 inanimate 内部的几何是否与 IT 一致)。若只有类别聚类在起作用,右列应无相关,但类内几何同样显著预测分类成绩(r=0.45 hIT,r=0.67 mIT),说明"像 IT"这件事本身(而不只是能分对两类)与计算性能挂钩——支撑结果 7 与"计算机视觉可向生物视觉取经"的论点。
讨论
作者把结论放在"深度监督模型与灵长类腹侧流的六个共同点"(前馈层级、线性滤波+静态非线性、卷积、局部感受野逐层扩大、足够深度、超过百万张标注图片的训练)的框架下解释:强监督训练对构造能解释 IT 几何的特征是必要的,非强监督模型之所以失败,正是因为它们不够"类别化"。作者据此把 IT 定性为"视—语义"表征:它表示视觉形状,同时又强加了超越视觉外观、与有机体生存繁殖相关的类别分界。讨论中作者还专门澄清了"类别化"的定义——他们主张不用"类别信息能否线性读出"这种常见的"显式性"标准(像素或颜色直方图也可能碰巧支持线性读出),而是把表征"类别化"定义为:它能提供的类别可分性优于任何无类别监督可学到的特征集,即它被"设计"(或进化/发育)来强调行为上重要的分界。对于大脑如何获得这些分界,作者提出"情境"论证:自然视觉经验中的时间共现、多模态信息、社交与语言信号都可能提供类似"监督信号"的东西,使生物学中的"无监督学习"与"监督学习"的界限变得模糊。
作者也坦承多重局限:第一,所测模型是纯前馈的,未涵盖视觉层级的循环动力学——尽管实验刻意用短呈现和注视任务聚焦"核心物体识别",同一刺激集的 MEG 研究仍提示主要类别分界的出现时间略晚于纯前馈解释的预测;第二,即便是获胜模型也必须被显式训练去强调 IT 特有的那些分界,为什么 IT 强调面孔/身体与有生命/无生命、而弱化人脸/动物脸之分,模型并未回答;第三,刺激集全是居中、孤立、灰背景、同等视网膜尺寸的图像,对位置、大小、杂乱背景的不变性没有挑战(不过作者引用 Cadieu 等 2014 的结果说明类别结构对这类变化是稳健的);第四,人类数据只有 4 名被试 8 个 session,"完全解释"只是在当前噪声水平下与 IT 不可区分,并不等于表征相同,需要更全面的数据集来暴露残余差异。文章还与多篇文献对话:与 Baldassi 等"形状相似性优于语义类别"的立场对比,作者强调视觉形状的解释力与语义成分的存在并不矛盾;并援引 Yamins 等、Cadieu 等的平行工作,指出在训练中加入"强调恰当类别分界"的读出特征是各研究共同的必要条件。
一句话总结
在我看来,这篇文章真正厉害的地方不是"深度网络赢了",而是把"模型与大脑的差距"拆成了可操作的成分:类别性不够(无监督模型全体落败)、特征本身缺失(重混重加权救不了弱模型)、监督信号才能补上(120 万张标签图 + 线性读出达标)。"IT 是视—语义表征"这个提法在我看来仍然是解释性的假说而非证明——毕竟"完全解释"受限于当前数据噪声——但它把"大脑为什么要这样表征"(为行为服务的行为 affordance)提到了建模工作台的正中央,这一点在今天的神经 AI 研究里仍是核心议题。
审校与证据追溯 (Verification & Evidence)
图表审计结果
- Fig1: 提取质量
good,对齐度full,识别面板[A, B] - Fig10: 提取质量
good,对齐度full,识别面板[] - Fig11: 提取质量
good,对齐度full,识别面板[] - Fig12: 提取质量
good,对齐度full,识别面板[A] - Fig2: 提取质量
good,对齐度full,识别面板[A, B] - Fig3: 提取质量
good,对齐度full,识别面板[] - Fig4: 提取质量
good,对齐度full,识别面板[] - Fig5: 提取质量
good,对齐度full,识别面板[] - Fig6: 提取质量
good,对齐度full,识别面板[] - Fig7: 提取质量
good,对齐度full,识别面板[] - Fig8: 提取质量
good,对齐度full,识别面板[] - Fig9: 提取质量
good,对齐度full,识别面板[]
关键事实与局限性声明
- 补充要点: LOC 结果未提及:非强监督模型中 combi27 对 LOC 相关最高(τA=0.14);深度网络 layer 7 最接近 LOC 噪声天花板但未达到(结果 7 只覆盖了 EVC/FFA/PPA 三个对照脑区)
- 补充要点: Text S1 / Figure S12、S13 的负向不对称结果未提:模型对 IT 中 animate 子簇几何的解释普遍好于 inanimate 子簇
- 补充要点: Figure S11 的另外两个分类任务(face/body、artificial/natural inanimate)性能结果未提,只报告了 animate/inanimate
- 补充要点: EVC 细节可补:HMAX-C2 是所有模型中与 EVC 相关最高者(τA≈0.22),深度网络 layer 2/3 也达 EVC 天花板