IT Literature Intelligence 终审版本 (VERIFIED) 论文编号:
125| 原始基线:V0_ZCODE_BASELINE| 语义审核:major_revision| 图表审核:passAstra裁决:compromise_revision(revise)
Temporal dynamics of visual category representation in the macaque inferior temporal cortex
Dehaqani · Journal of Neurophysiology · 2016 · Zotero itemID=1281
这篇文章用猕猴下颞叶(inferior temporal, IT)皮层 674 个神经元对约 1,000 张物体图片的响应,系统地比较了上位(superordinate,如"动物")、中位/基本(mid-level/basic,如"人脸")与下位(subordinate,如"个体身份")三类范畴信息在神经响应中出现的时间先后。核心发现是中位类别信息最先浮现——视觉皮层先把类别形状空间沿"最锐利的边界"切开——这为心理物理学上"基本水平优势"提供了一个单细胞分辨率的神经机制,也把 Sugase 等人"全局先于精细"与人类 MEG 相反结论的矛盾摆到了台面上。
研究背景
物体可以在不同抽象层级上被识别:上位(例如"动物")、中位/基本水平(例如"鸟")、下位(例如"鹰")。心理物理学(psychophysics)研究早已发现,人对中位类别信息的感知提取快于更高或更低层级(Rosch 等 1976;Tanaka & Taylor 1991,以及 Mack & Palmeri 2015),但另一批快速分类实验(Fabre-Thorpe 等 2001;Macé 等 2009)反驳了这一优势,证明上位类别信息同样可以被速达。在神经层面,时间过程的问题更不清楚:人类 MEG 研究显示越抽象的类别信息出现越晚(Carlson 2013;Pantazis 2014),而 ERP 研究(Thorpe 1996)却报告上位"动物"类别可以被极早检测;这两类记录手段空间分辨率有限,混合了来自不同脑区、输入与输出交织的群体信号,无法定位类别信息具体何时出现在某个神经结构里。
猕猴 IT 皮层是腹侧视觉通路的末端、纯视觉区域,包含多种类别选择性的神经元(Bruce 1981;Fujita 1992;Kiani 2007)。此前 Sugase 等(1999)与 Matsumoto(2004)发现 IT 单细胞响应中全局信息(如"猴脸 vs 人脸")早于精细信息(身份)出现,提出"由粗到细"的时间梯度假说——但这一假说无法解释行为上中位类别的快速通达。作者指出,要回答这些问题必须在锋电位(spike)层面直接记录个体神经元的发放,在大规模天然图片集上同时追踪多个抽象层级的表征时间。
研究思路
作者的总体策略是把"行为的basic-level优势"翻译回神经群体动力学的语言:与其争论哪一层最先被表示,不如用一个统一的无监督指数(SI,可分性指数)加一个有监督读出(线性 SVM 分类器)去追踪每个层级在神经空间里"类间距离大于类内散度"何时成立。设计上的关键在于三个层面的对照:刺激集覆盖同一物体族系的三个抽象层级(图 1),使上/中/下位之间的比较是嵌套而非拼凑的;分析窗口滑动、指数阈值固定,使不同层级的 onset/peak 可直接比较;再加系列排除性控制(剔除面孔刺激、剔除面孔神经元、形状距离匹配、RSVP 前置刺激分组、IT 各亚区分别计算、物理相似度模型预测),把"中位更早"可能与面孔刺激、熟悉度、物理特征等混杂逐一剥离。
方法
数据来自两只雄性猕猴的 IT 皮层(Kiani 等 2005、2007 的既往数据),共 674 个神经单元,记录位点覆盖除后部 IT(TEO)以外的所有亚区(STS 下岸、TEv、TEd、TEp/TEa)。刺激为 1,000 余张彩色对称抠图照片,居中呈现在 7° 视窗内,采用快速序列视觉呈现(rapid serial visual presentation, RSVP):每张 105 ms、无空白间隔,猴子需把注视点保持在小 ±2° 窗口内。分层类别结构包括上位(有生命/无生命)、中位(脸/身体、灵长类/非灵长类脸、人/动物身体、恒河猴/非恒河猴脸、自然/人造无生命物、以及多组人类 vs 动物的具体类别)、下位(4 个人脸个体身份等)。
分析在群体与单细胞两个层面进行。群体层面把每时刻的响应写成 674 维向量(z 标准化去偏),用基于相关距离的多维标度(MDS)和 PCA 展示类别聚散;用可分性指数(separability index, SI)——类间散度矩阵与类内散度矩阵谱范数之比,在 20 ms 滑窗(步长 1 ms)上追踪——并用 500 次 bootstrap 估标准误;同时用 70%/30% 划分训练线性 SVM 得归一化分类精度。Onset 定义为指数首次超过其最大值 10% 且维持 10 ms,peak 为超过 90% 并维持 2 ms(结论对该阈值不敏感)。单细胞层面用接受者操作特征曲线(ROC)下面积(AUROC)在滑窗内衡量单神经元对每对类别的判别力,并用随机化检验(基于 d',P<0.05)确定类别选择性,选出对三对关键类别都选择性的 126 个神经元。聚类树用凝聚层次聚类在早期(85–105 ms)与晚期(155–175 ms)响应上分别重建,节点与类别的匹配度用两个比例的均值打分(Kiani 2007 的做法)。
主要结果
- 早期响应只切得开中位类别:MDS 二维图显示,85–105 ms 的早期相位里 IT 群体响应可分出人脸 vs 身体、灵长类脸 vs 非灵长类脸,但分不开有生命 vs 无生命,也分不开 4 个个体身份;到 155–175 ms 晚期,所有层级才全部可分(图 2;前两维解释方差早期 67%、晚期 74%,PCA 前两维解释 62%,图 3)。补充动画(Supplemental Movie 1)中可见灵长类脸最先从其它刺激中"逸出",接着是身体,最后才聚出 animate/inanimate 与个体身份群。
- 群体 SI 时间进程给出明确顺序:中位类别的 onset 与 peak 都显著早于上、下位(P<0.001,图 4)。Onset:animate/inanimate 105.9±0.64 ms,脸/身体 82.3±0.74 ms,灵长类/非灵长类脸 83.3±1.26 ms,人脸身份 103±14.7 ms;peak 分别为 148.7±3.3、121.9±3.2、105.1±3.6、152.2±16.5 ms。表 1 把这一趋势推广到 25 组中位对照(如"人 vs 动物身体"onset 仅 79.5±0.73 ms),表 2、3 表明无论对照类别取"其它所有""无生命"还是"其它有生命",脸与身体类别的出现时间都早于上位对照。
- SVM 读出把差距放到下游可见的量级:下游结构可以早到 72.5±2.9 ms(脸/身体)与 76.1±1.7 ms(灵长类/非灵长类脸)就把中位类别读到高于理解水平,而上位与身份要晚 10–30 ms 才显著(animate/inanimate 85.4±4.7 ms;身份 95.7±8.2 ms;P<0.01);peak 时间差距更大(35–50 ms,P<0.01):脸/身体 116.6±4.4 ms、灵长类脸 106.8±4.6 ms、animate/inanimate 135±7.5 ms、身份 150.4±5.1 ms(图 5)。
- 无监督聚类树印证:凝聚层次聚类在 85–105 ms 已形成脸簇、95–115 ms 出现身体簇,而 animate 大簇直到 155–175 ms 才成形(图 6);表 6 显示上位类别在树中的匹配分从早期到晚期上升最多(animate 0.13、inanimate 0.09),而多数中位类别分数不升反降(如人脸 −0.08),即中位结构在早期已就位。
- 单细胞与非选择性子群都保序:126 个对三对关键类别都选择性的神经元中,AUROC onset 为脸/身体 81.6±1.20 ms、灵长/非灵长脸 78.3±1.16 ms,早于 animate/inanimate 的 87.4±1.43 ms(P<0.05)与身份的 85.7±4.85 ms(P<0.05);peak 差距更大(113.1、107.8 vs 141.4、143.0 ms,P<0.001,图 7)。且神经元类别选择性越强(d' 越大)其 onset/peak 越早(多数类别对负相关显著),唯独身份 onset 不相关(r=0.15,P=0.21)。157 个对脸、身体、animate、inanimate 都无显著选择性的神经元组成子群,其群体 SI 依然呈现同样的时间顺序(图 8;onset:animate/inanimate 135.6±16.21 ms vs 脸/身体 96.2±4.34 ms)。
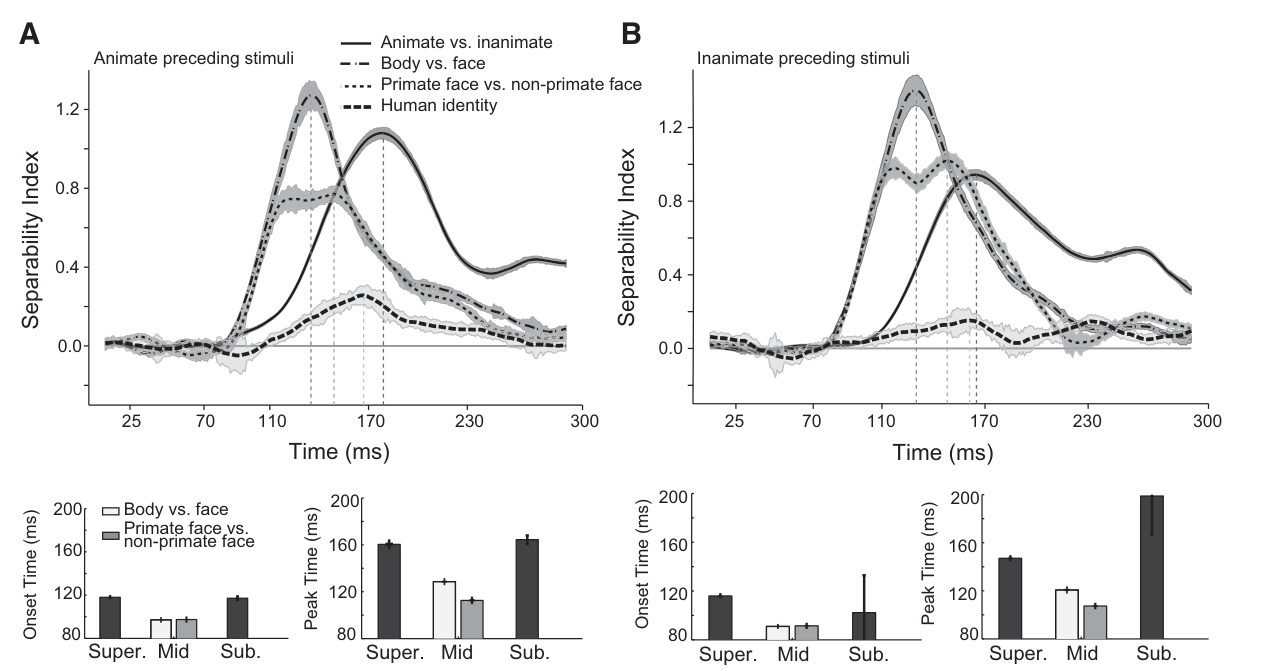
- 与物理相似度无关,且在各类控制下稳健:25 组中位类别的出现时间整体早于 animate/inanimate(t 检验 P<0.001,图 9A),但用 V1/V2/V4(HMAX 各层)、footprint、基本属性五个物理模型算出的类内/类间差异预测不了任何一对的 latency(图 9B 各面板相关均不显著,如 V1 onset r=0.33、P=0.096)。把面孔刺激整体剔除或剔除面孔神经元,中位优势仍在(表 4);29 组仅脸不同的身体图像对显示"带脸身体"的 SI 强度更大(0.58±0.01 vs 0.26±0.01,P<0.001)但两组 latency 无差;类内形状相似度匹配后结论不变(表 7);IT 各亚区(STS、TEd、TEv、TEp/TEa)单独分析结论一致(表 8);RSVP 中前置 animate 或 inanimate 的试次分开算,中位优势同样保留(条件 a onset:animate/inanimate 118±0.14 ms vs 脸/身体 97.1±0.31 ms;条件 b 116±0.22 vs 91±0 ms;图 10)。
图注解读
图 1 · 刺激集的三层类别树
原文图注:Fig. 1. Hierarchical category structure of the stimuli. Three category levels are defined: 1) superordinate level: animate vs. inanimate; 2) mid-level (basic level): face vs. body, primate faces vs. nonprimate faces, human body vs. animal body, rhesus face vs. nonrhesus face, and natural inanimate vs. artificial inanimate; 3) subordinate level: human individual identity. Photos courtesy of Hemera Photo-Objects/Jupiterimages.
这张树状示意图给出整个任务的语言:从 animate/inanimate 的顶层,分出脸/身体、灵长/非灵长脸等基本水平层,再到 4 个人脸个体的最底层。读图时注意嵌套关系——同一张图片同时属于上、中、下三级类别,这是后文所有"层级间 latency 比较"得以成立的前提。
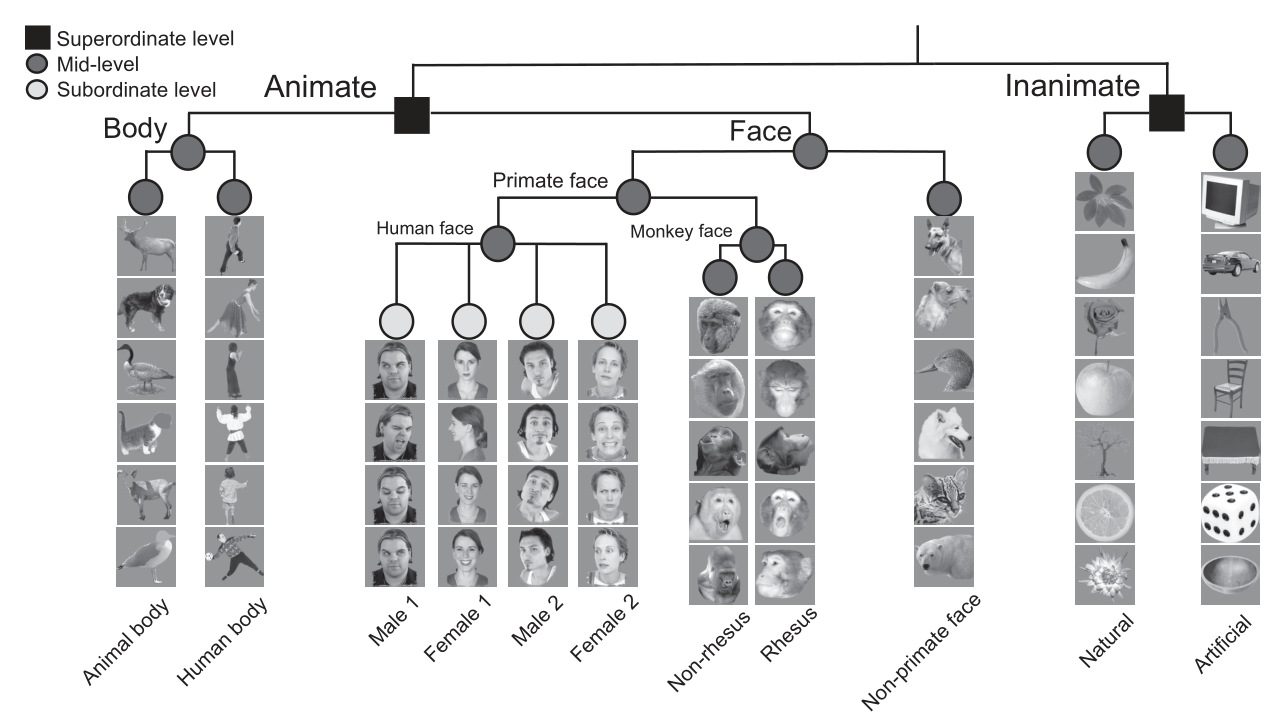
图 2 · 早期与晚期响应的 MDS 二维图
原文图注:Fig. 2. 2D Representations of categories at 3 levels of hierarchy in early and late phases of neural responses. These representations are generated using multidimensional scaling on the neural population responses at 3 levels of the hierarchy. Early (85–105 ms; left) and late (155–175 ms; right) phases of the neural responses are shown. The rows show animate vs. inanimate, face vs. body, primate faces vs. nonprimate faces, and 4 human face identities. Ellipses demonstrate 2 SD of the distribution of category members in the 2D representations.
每行一个层级、左右两列分别是早期(85–105 ms)与晚期(155–175 ms)相位的 MDS 投影,椭圆为成员分布的 2 个标准差。读图要点:早期相位里只有"脸 vs 身体""灵长/非灵长脸"两行出现分离椭圆,animate/inanimate 与 4 个身份的椭圆仍互相重叠;晚期所有行的椭圆都拉开。这张图是"中位类别最先被表示"结论的直观版本,支撑主要结果 1。
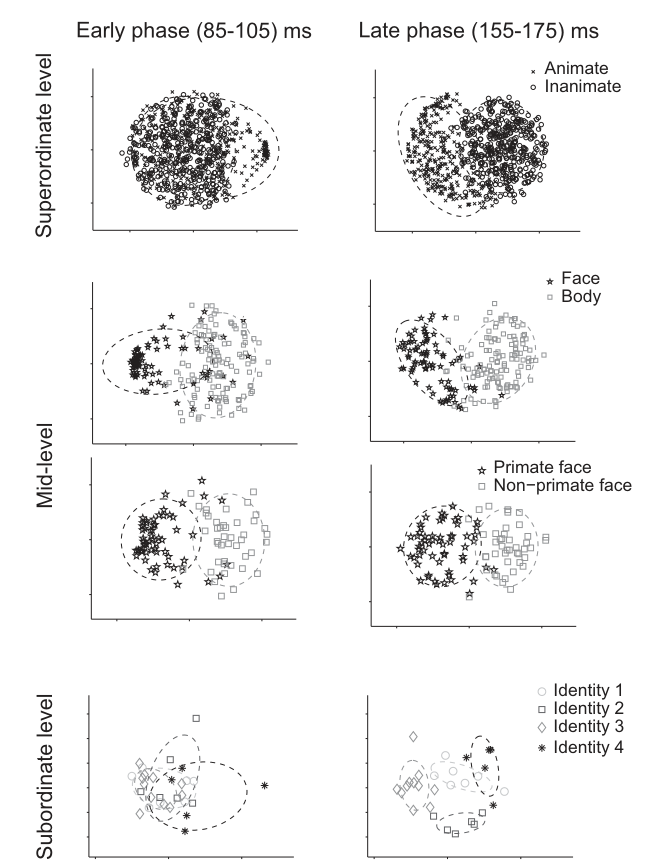
图 3 · PCA 降维的方差解释率
原文图注:Fig. 3. The percentage of unexplained variance. The percentage of unexplained (residual) variance against the number of PCA dimensions used for construction of the movie. The first 2 dimensions of the PCA analysis reported here were used to make the movie. The neural population responses to all stimuli in the 65- to 170-ms time window were used to extract the principle dimensions by PCA. The gray arrows indicate the values for second, fourth, sixth, and eighth dimensions.
横轴为所用 PCA 维数,纵轴为未解释方差百分比,用于佐证"用前两维做二维动画/地图是否足够"(第 2 维约解释 62% 方差)。它是一个方法支撑图:说明 Supplemental Movie 1 与 Fig. 2 的二维展示没有丢掉太多信息。
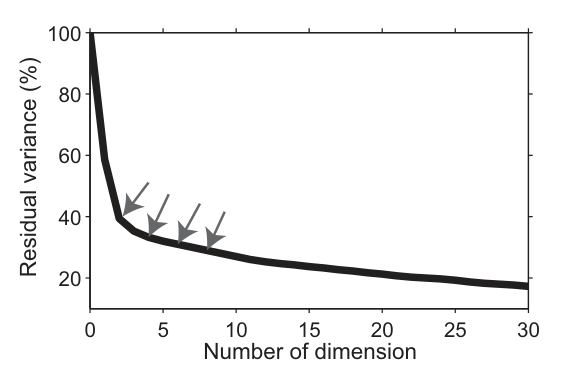
图 4 · SI 时间进程与 onset/peak 延迟
原文图注:Fig. 4. Time course of the separability index (SI) for the 3 levels of hierarchy. A: time courses of SI. The time courses were offset by the mean value of index at the 1- to 50-ms interval from stimulus onset. Shaded areas represent SD, calculated using the bootstrap procedure. Surrounding scatter plots are 6 frames from Supplemental Movie 1. The 107-, 127-, and 161-ms time points correspond to SI peak times of primate faces vs. nonprimate faces, face vs. body, and animate vs. inanimate, respectively. B: onset (left) and peak (right) latencies of SI; onset latency is defined as the first time that the index exceeds 10% of its maximum value for 10 ms. Peak latency is defined as the time that the index exceeds 90% of its maximum value at least for 2 ms.
A 图为四对类别的 SI 随时间变化曲线(已经用 1–50 ms 基线对齐),周围散点是补充动画里 t=35、85、107、127、161、260 ms 的六帧快照,直观展示"脸先现、身体后至、最外层大类别最后"的过程。B 图为 onset 与 peak 的延迟条图,Super./Mid/Sub. 三个分组一目了然:中位的两根柱都最短。这是全文核心定量图,支撑主要结果 2。
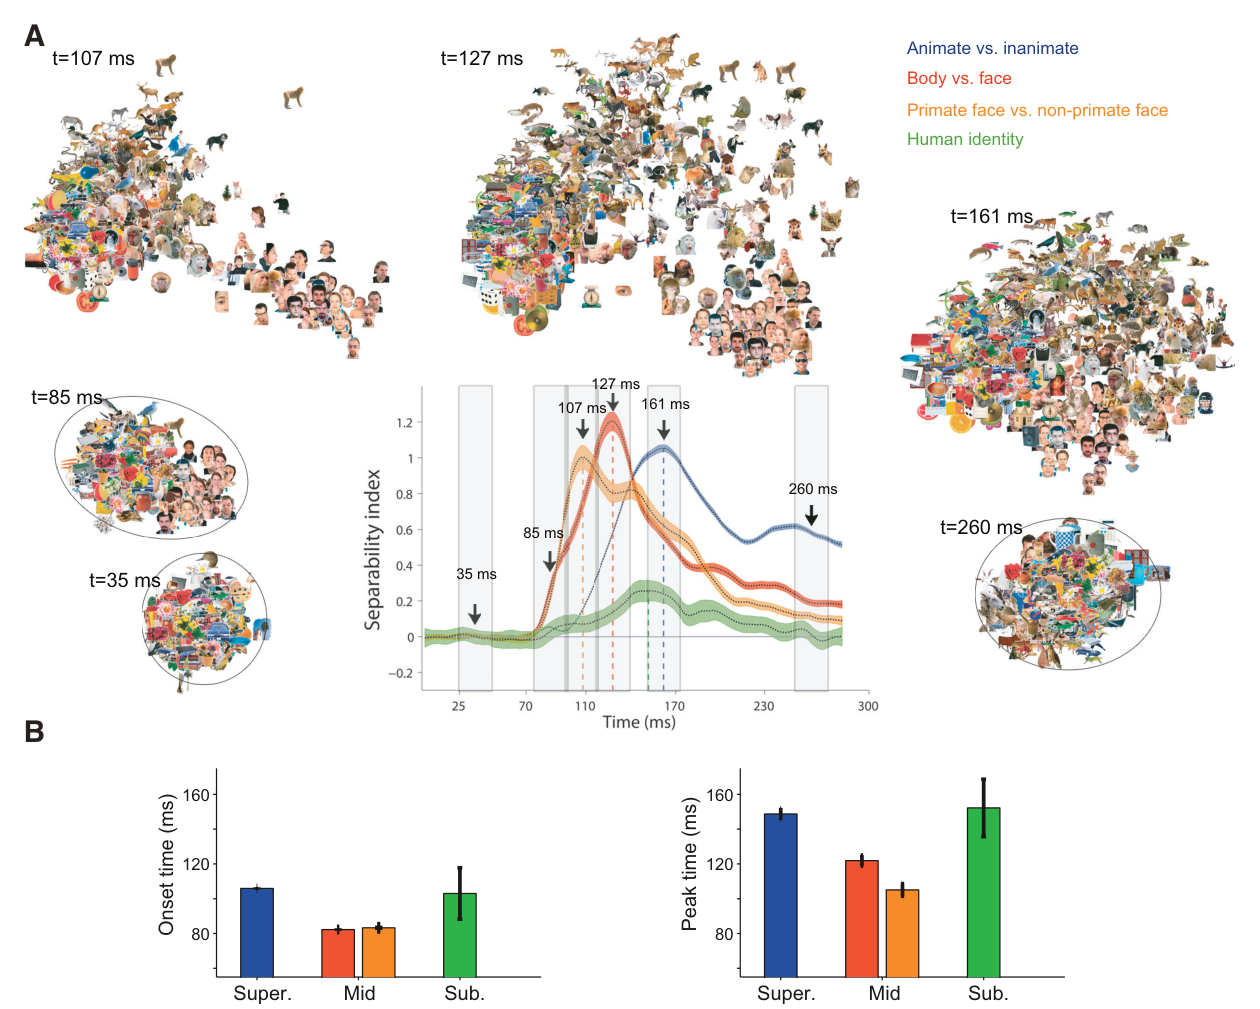
图 5 · SVM 分类精度的时间进程
原文图注:Fig. 5. Time courses of classification accuracy for the 3 levels of hierarchy. A: time courses of normalized classification accuracy using SVM. Shaded areas are the SE. B: corresponding onset (left) and peak (right) latencies.
A 图为归一化分类精度时间曲线(0 为理解水平、1 为完美),B 图为对应的 onset/peak 延迟条图。它与图 4 互为印证:从有监督读出的角度看,中位类别同样最先被解码(onset 72.5±2.9 ms 与 76.1±1.7 ms)。差别在于 SVM 用单试次可读信息、SI 直接衡量聚类几何,两者一致意味着结果不依赖于特定指数,支撑主要结果 3。
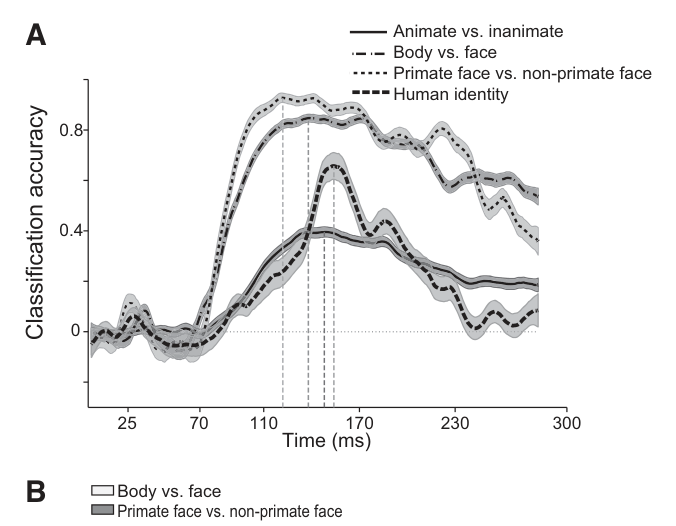
图 6 · 早期与晚期相位的层次聚类树
原文图注:Fig. 6. Hierarchical clustering of IT response patterns at early and late phase of response. Hierarchical cluster trees were computed at early (A and B; 85–105 and 95–115 ms, respectively) and late (C; 155–175 ms) phases of response. At the lowest level of the tree (horizontal axes), face, body, other animate, and inanimate exemplars are indicated by red, purple, yellow, and blue lines, respectively. All animates, excluding face and body categories, make "other animate" stimuli. The vertical axes indicates average neural distance between the stimuli of subclusters.
A、B、C 分别为 85–105、95–115、155–175 ms 三个时间窗的凝聚聚类树,树底端枝叶按类别着色(红脸、紫身体、黄其他动物、蓝无生命物),纵轴为子簇间平均神经距离。读图时看聚类在什么时间"长出"什么分支:脸最先成簇,10 ms 后身体跟上,而 animate 大簇要到晚期才成形。因为这是无标签的无监督分析,它为"中位先于上位"提供了不依赖任何预定义指数的独立证据,支撑主要结果 4。
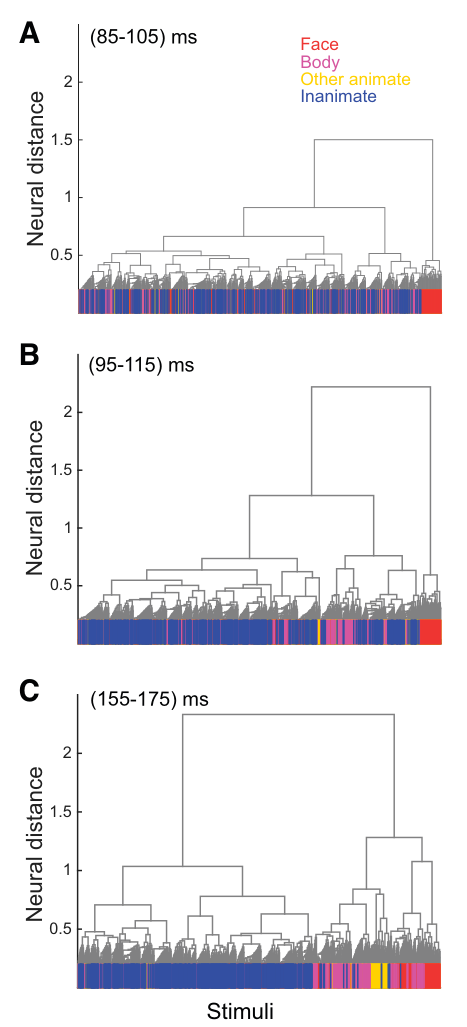
图 7 · 单细胞 onset/peak 延迟散点与分布
原文图注:Fig. 7. Onset and peak-latency scatter plots of single cells. Each panel (A–D) shows the scatter plot of onset (triangles) and peak (circles) latencies of 1 pair of categories against another pair (A: face vs. body against animate vs. inanimate, B: primate faces vs. nonprimate faces against animate vs. inanimate, C: face vs. body against human identity, and D: primate faces vs. nonprimate faces against human identity). Each point represents 1 cell. The distributions of latencies (top: onset; bottom: peak) for the corresponding categories are depicted on the right side of the scatter plots. The dashed, vertical lines in distribution plots show the mean latencies.
四个面板把每对类别的单细胞延迟两两作散点(三角 onset、圆 peak,每点一个细胞),边缘直方图给出延迟分布与均值(虚线)。若一个细胞在两对类别上的延迟相同,点应落在对角线上;实际点多偏向"中位类别更早"一侧。这张图把群体层面的结论落实到个体神经元层面,支撑主要结果 5。
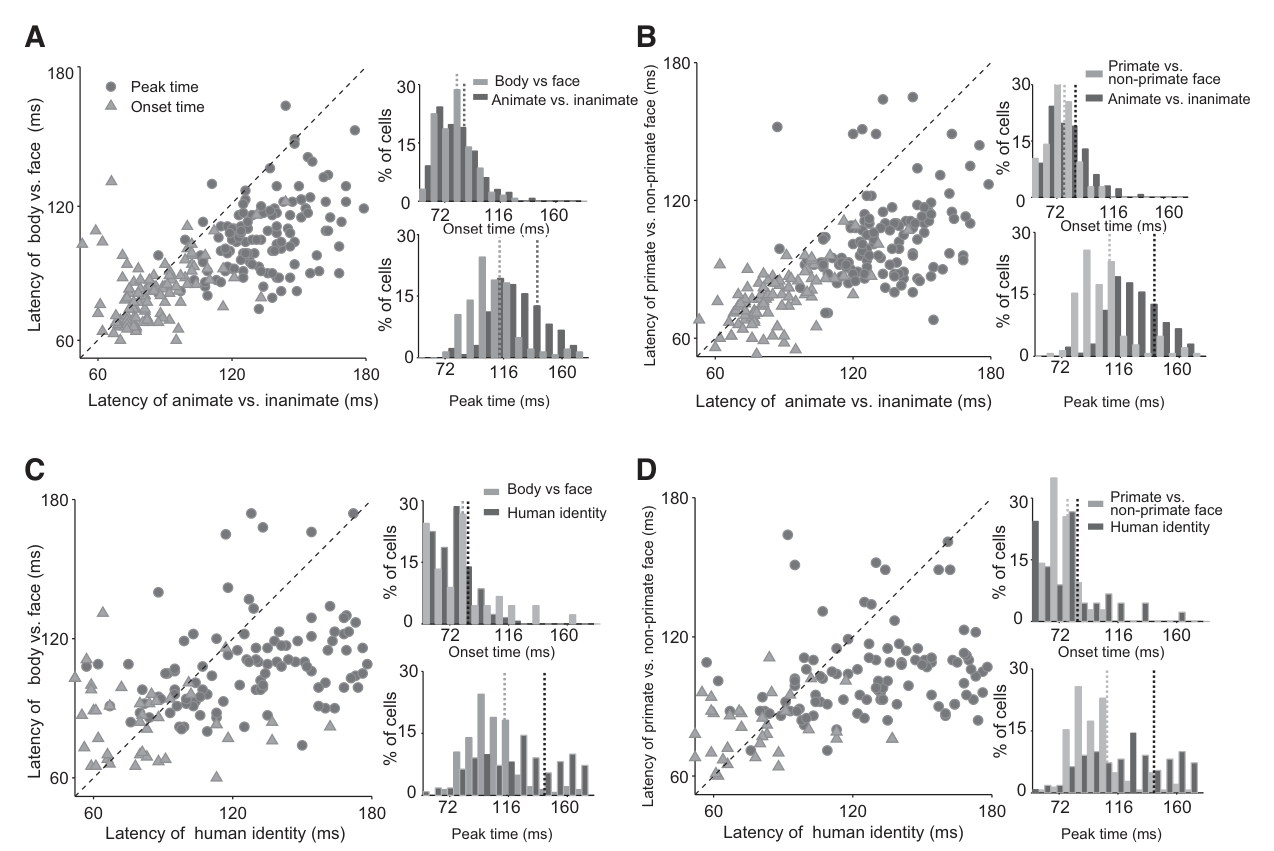
图 8 · 非选择性神经元的 SI 时间进程
原文图注:Fig. 8. Time courses and latencies of separability index (SI) in the nonselective cell population at the 3 levels of hierarchy. A: time courses of nonselective cell population. Nonselective cells are those that show no significant selectivity to face, body, animate, or inanimate images. Selectivity of the target category against the other stimuli is examined by 1-tailed t-test, P ≤ 0.05. B: the mean onset (left) and mean peak (right) latencies are shown. Shaded areas (A) and error bars (B) represent SE.
这张图只用 157 个对四类目标都没有显著选择性的神经元重做群体 SI 分析,格式与图 4 相同(A 时间进程、B onset/peak)。结论是时间顺序照样成立(onset:脸/身体 96.2±4.34 ms 早于 animate/inanimate 的 135.6±16.21 ms),说明复现"中位优势"不需要任何显式类别选择性的细胞——改为:即使组成群体的神经元对指定类别均未单独达到显著选择性标准,汇集的群体响应模式仍可包含类别信息,并呈现类似的时间顺序。删除“信息藏在人群体的相关结构里”,避免将其解释为噪声相关机制的证据。。支撑主要结果 5 的后半。
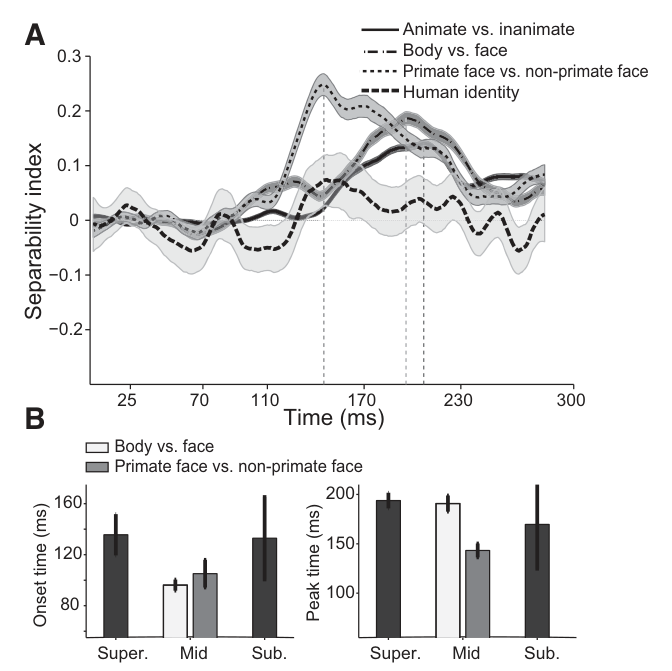
图 9 · 25 组中位类别的延迟分布与物理模型的失败
原文图注:Fig. 9. Distribution of latencies and relationship of physical similarity and latencies of category representation in IT cortex. A: the distribution of onset (left) and peak (right) latencies for 26 pairs of tested categories (25 mid-levels and 1 superordinate level). The dashed lines show the onset (left) and peak (right) latency of superordinate level, animate vs. inanimate, and the arrows show the mean value of latency distributions. B: in each panel, we calculated the within/between class physical distinction using SI and different physical models (V1, V2, V4, foot print, and basic properties) …
A 图给出 26 对类别(25 组中位 + 1 组上位)的延迟直方图,虚线为 animate/inanimate 的 onset/peak,箭头为中位均值——分布整体落在虚线之前(t 检验 P<0.001)。B 图把每个物理模型(HMAX 的 V1/V2/V4 层、footprint、基本属性)计算的类别可分性与神经 latency 作散点,各面板的相关系数与 P 值均不显著(如 V1 onset r=0.33、P=0.096;V2 peak r=−0.15、P=0.46),大菱形为 animate/inanimate。这是排除"物理特征相似度决定时间"这一关键备择假说的图,支撑主要结果 6。
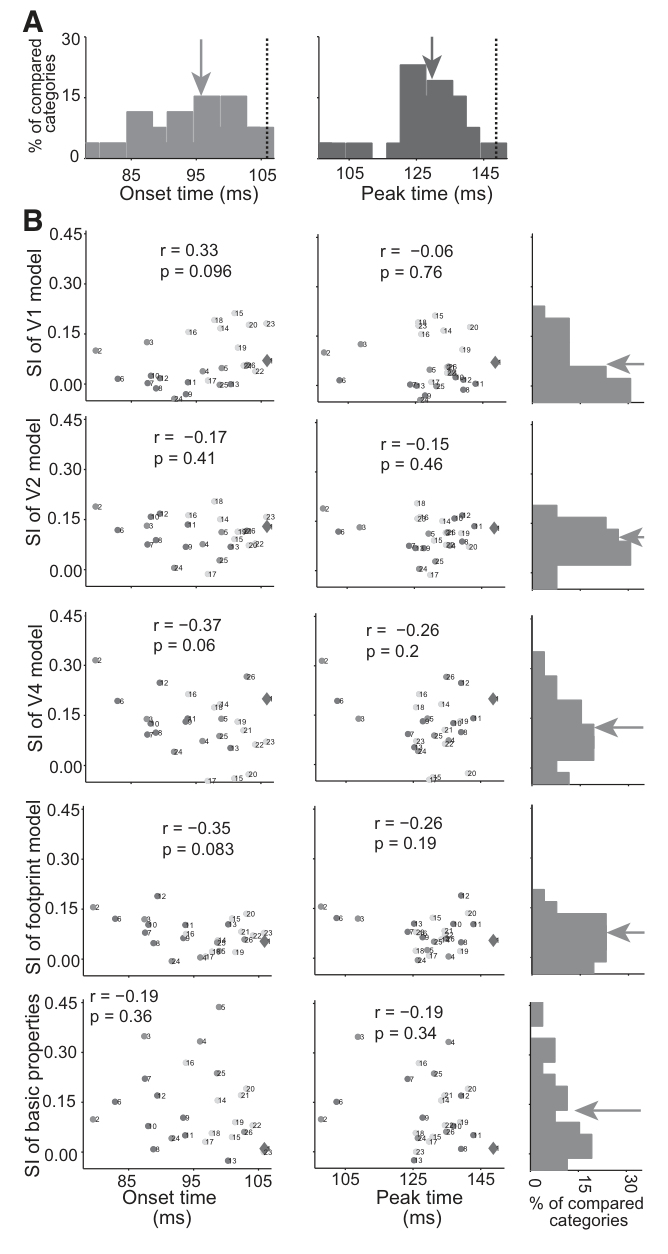
图 10 · RSVP 前置刺激的分组对照
原文图注:Fig. 10. The time course of category representation in trial with animate or inanimate preceding stimuli. Time courses of separability index, the mean onset, and mean peak latencies were computed in trials in which an animate image preceded the stimulus (A) and those in which an inanimate image preceded the stimulus (B). Shaded areas (top) and error bars (bottom) represent SE.
RSVP 无空白的连续呈现会让前面图片的 spike 污染后面图片的响应,A、B 分别限定"前一张是 animate""前一张是 inanimate"再重算 SI 进程与延迟。两组的中位优势都完整保留(如条件 a:脸/身体 onset 97.1±0.31 ms 早于 animate/inanimate 的 118±0.14 ms),图10解读及讨论中的相关表述统一改为:按前一刺激为animate或inanimate分别分析后,中位类别的时间优势仍保留,说明该效应不太可能完全由前一刺激的大类别造成;这一控制不能排除全部RSVP相互作用、残留响应或更细粒度的序列效应。将“会让前面图片的spike污染”改为“可能受到前置刺激残留响应的影响”。。支撑主要结果 6 的稳健性论证。
讨论
作者首先承认最关键的局限:数据全部来自被动注视的猴子,神经时间进程与行为性视觉分类之间的关系"无法在本研究中直接确立",需要后续任务态研究补上从神经顺序到行为顺序的桥梁。在此前提下,讨论主要回应三个矛盾。其一,与 Sugase(1999)、Matsumoto(2004)的"全局信息先于精细信息"假说:本文的中位优势结果与之方向一致(灵长/非灵长脸确实早于身份出现),但 Sugase 的框架解释不了行为上中位类别的快速通达,而本文把解释落到了形状空间边界的几何性质上。其二,与人类 MEG 的"精细信息反而先出现"(Carlson 2013;Pantazis 2014)之争:作者辩称 spike 是神经元的输出,而 MEG/EEG 信号混合了突触输入、输出、同步及电荷几何等因素,个体图像差异可能在输入端就更明显,中位类别优先性则出自 IT 本地对输入信息的加工——两种技术测到的并不是同一层过程。其三,Fabre-Thorpe 等行为实验中"上位类别快速检出"的结果与本文不冲突:动物检测任务完全可以靠对脸或身体的快速判读完成,本文给出的正是这一机制的神经版本。作者还逐条清点了自己的控制:类内异质性随抽象层级单调上升,故上位延迟不能用刺激多样性解释;排除面孔刺激或面孔神经元后结论仍在;两只猴子独立复制;类别样本数均衡后结论不变;RSVP 尖峰污染经前置刺激分组排除;亮度对比差异由嵌套类别结构控制。关于机制,作者提出中位类别或许由 IT 本地加工即可表达(形状空间在"类内聚合、类间分立"处存在最锐利的边界),而更高抽象层级的类别边界可能需要前额叶参与(援引 Freedman 2003);学习可压缩中位与下位之间的延迟差——熟悉类别(人/猴脸与身体)的 onset 更早而各类别的 peak 都保持提前,提示学习影响 onset 但不影响 peak。最后作者坦承刺激集的不足:上位对照只有 animate/inanimate 一对、下位类别只有 3 个,且两只猴子为宠物饲养背景、视觉经验比常规实验猴更丰富;与 Baldassi(2013)、Yamins(2014)等质疑"IT 存在真正 animate/inanimate 边界"的工作之间的分歧,可能源于记录的 IT 区域、刺激集规模与形状变异性不同。
一句话总结
(依我的理解)这篇文章真正的贡献是把"基本水平优势"从心理物理学搬到了单神经元发放的时间轴上:IT 皮层在刺激后不到一百毫秒就按"类内聚合、类间分立"的几何秩序切开了形状空间,而且这一秩序不依赖显式的面孔神经元,也预测不了任何主流物理特征模型。它的软肋同样清楚——被动注视的 RSVP 范式、上位对照只有一对、对 MEG 矛盾的调和靠"信号性质不同"的辩护而非直接检验——但作为把类别时间动力学做成系统定量科学的第一批工作之一,它的分析框架(SI + 分类读出 + 聚类树三管齐下)至今仍是这个方向的模板。
审校与证据追溯 (Verification & Evidence)
图表审计结果
- Fig1: 提取质量
good,对齐度full,识别面板[] - Fig10: 提取质量
good,对齐度full,识别面板[A, B] - Fig2: 提取质量
good,对齐度full,识别面板[] - Fig3: 提取质量
good,对齐度full,识别面板[] - Fig4: 提取质量
good,对齐度full,识别面板[A, B] - Fig5: 提取质量
good,对齐度full,识别面板[A, B] - Fig6: 提取质量
good,对齐度full,识别面板[A] - Fig7: 提取质量
good,对齐度full,识别面板[A, B, C, D] - Fig8: 提取质量
good,对齐度full,识别面板[A, B] - Fig9: 提取质量
good,对齐度full,识别面板[A, B]
关键事实与局限性声明
- 审校纠偏: 在该刺激集与被动RSVP条件下,IT群体SI、线性分类读出及单细胞AUROC总体显示中位类别信息早于animate/inanimate和身份信息出现。 -> 评注: 这是对记录数据及所选类别对的描述;部分具体中位对照未达到显著性,三个层级的刺激集合和条件数量也不平衡。
- 审校纠偏: 视觉皮层首先沿类内相似度高、类间相似度低的最锐利边界划分类别形状空间。 -> 评注: 这是作者依据时间顺序和SI几何提出的解释;研究没有直接鉴定决定这些边界的视觉特征,也没有操纵边界锐度。
- 审校纠偏: SVM显示下游结构最早可在约73–76 ms读取中位类别。 -> 评注: 线性SVM是理想化读出模型,并非对真实下游脑区的同步记录或因果验证。
- 审校纠偏: 更高层级类别可能需要前额叶参与,MEG中的早期个体信息可能反映IT输入,而锋电位中的中位优势来自IT局部加工。 -> 评注: 本研究没有记录前额叶,也没有同步获得MEG、突触输入或局部回路指标;这些是作者用于调和不同研究的候选解释。
- 审校纠偏: 研究证明了心理物理基本水平优势的单细胞神经机制。 -> 评注: 猴子仅被动注视,没有行为分类测量或IT因果操纵,神经—行为联系不能直接建立。
- 审校纠偏: 物理相似性与时间顺序无关,任何主流物理模型都不能预测结果。 -> 评注: 只检验了五类指定表征;结果是跨类别对没有显著相关,不能排除统计功效不足或未建模的诊断性特征。
- 审校纠偏: 该分析框架至今仍是领域模板。 -> 评注: 该历史影响判断不来自论文原文,两个给定文件不足以验证。
- 补充要点: 若干中位类别对照未达到显著性: 总体趋势支持中位类别较早,但Tables 1-3包含多项与上位条件差异不显著或无法得到显著SI的对照。该负结果应与“25组中位类别整体更早”的汇总结果同时呈现,避免把总体趋势写成逐项普遍规律。 (第 6-7 页)
- 补充要点: 层级条件数量及刺激集合不平衡: 作者明确指出刺激集只允许比较1个上位类别对、16个中位条件和3个下位条件,并认为需要更平衡的刺激集才能充分理解中位与下位时间差。V0提到1个上位和3个下位,但应补入16个中位条件及“需要平衡刺激集”的结论。 (第 12 页)
- 补充要点: 既往RSVP呈现时序对照: 作者引用同一刺激集的既往分析:245 ms呈现加245 ms空白与105 ms无空白两种条件之间,人脸和动物脸的IT响应延迟无显著差异。这是对RSVP时序疑虑的额外控制,但V0未收录。 (第 12 页)
- 补充要点: 全部响应神经元的单细胞复核: 除126个对三组类别均选择性的细胞外,作者还报告使用65–170 ms内AUROC显著的全部响应神经元时得到相似结果。V0只呈现了126个细胞分析。 (第 8 页)