IT Literature Intelligence 终审版本 (VERIFIED) 论文编号:
144| 原始基线:V0_ZCODE_BASELINE| 语义审核:needs_major_revision| 图表审核:passAstra裁决:compromise_revision(revise)
Neural Dynamics Underlying Target Detection in the Human Brain
Bansal · The Journal of Neuroscience · 2014 · Zotero itemID=1434
这篇文章用颅内场电位(intracranial field potential,IFP)记录,在 10 名癫痫患者脑内的 776 个电极上追问了一个看似简单的问题:当你在图像里"找"某个目标类别时,大脑对同一张图的反应会发生什么变化。作者发现目标的出现与否会强烈调制腹侧视觉流(尤其是下颞回和梭状回)的生理反应,但这种调制要等到刺激后约 250 ms 才出现,明显晚于视觉识别信号本身。它值得读,是因为它直接在人类皮层内给出了"自下而上识别"与"自上而下目标检测"在时间上分离的电生理证据,并约束了两者的先后关系。
研究背景
视觉信息的价值最终取决于任务:过马路前判断有没有车,需要把进入眼睛的信号与"要找车"这个目标做比较,才能输出正确的行为。当时已知的是,下颞皮层(inferior temporal cortex,ITC)是物体识别的核心区域——来自损伤研究、神经生理记录和脑成像的证据都指向这一点,而且腹侧视觉流的快速反应通常被描述为自下而上(bottom-up)、与任务无关的信号;另一方面,注意、分类和视觉搜索研究中都观察到了任务对视觉反应的调制,若干计算模型也引入了自上而下(top-down)信号来解释这类效应。缺口在于:快速视觉信号究竟如何以任务依赖的方式被处理、用于明确的识别并指导行动,这个问题并不清楚。
具体到时间进程,当时存在两条看似矛盾的线索。一条是,图像呈现后 150 ms 内的视觉信号似乎已足以解释图像内容并指导任务反应,甚至不需要注意参与;另一条是,头皮脑电研究指出 150 ms 之后的信号才是行为与明确识别的更好指标,而且任务需求可能通过额叶皮层与视觉区之间的延迟交互来实现。要在人类身上分辨这两条线索,头皮记录的空间分辨率不够,而颅内记录恰好提供了毫秒级时间精度加上解剖定位的窗口——这正是本文的方法学起点。
研究思路
作者的总体策略是把"物理输入"与"任务目标"解耦:在每个 block 开始时提示一个目标类别(动物、车、椅子、人脸或房子五类之一),然后每试次闪现 100 ms 的图像,图像里含一个或两个物体,被试只需报告目标类别是否出现,目标出现概率约 1/3。由于同一张图既可能出现在目标出现的试次、也可能出现在目标缺失的试次,图像本身完全相同,那么"目标出现 vs 目标缺失"之间的反应差异就只能归因于任务目标的自上而下影响,而不是刺激本身的差别。这个设计是全文逻辑链的第一环。
第二环是把现象做定量刻画并排除替代解释。作者先定义哪些电极存在目标调制(宽带与各频带分别检验),再比较调制延迟与视觉选择性反应的出现时间,用单试次解码刻画各脑区目标信息的时间进程,最后用眼动追踪、电极的空间特异性、与运动对齐方式的比较来排除眼动和运动准备的解释。这样得到的结论既有空间分布(哪些区域),也有动力学(何时开始),可以同时约束注意与目标检测的模型。
方法
被试是 10 名药物难治性癫痫患者(7 女、8 右利手、10.3–46.5 岁),为定位致痫灶而临床植入颅内电极,每例 64–104 个记录位点,共 776 个电极;信号以 256 或 500 Hz 采样,经 60 Hz 陷波和 0.1–100 Hz 带通滤波。电极定位通过把个体 MRI 配准到 Talairach 空间、CT 与 MR 图像配准,并用 FreeSurfer 2009 图谱把每个电极归入 75 个脑区之一。行为上,每 block 50 试次,共 1134.8±430.3 试次/人;正确率 92±7%,平均反应时 775±299 ms;由于任务正确率很高,所有分析只取正确试次,分析窗口为刺激后 0–600 ms。
电极被判为"目标调制"需满足两条:一是目标出现与缺失试次的 IFP 有显著差异(双侧 t 检验 p<0.01)且方向一致地持续至少 70 ms(该参数用打乱标签的数据校准到错误发现率 FDR 约 1%);二是峰值差异至少 28.8 µV(约为全电极噪声水平估计的两倍),以筛掉微小波动。频域分析用三阶 Butterworth 滤波把信号分成 0.1–100(宽带)、0.1–4、4–8、8–12、12–35、35–50 与 70–100 Hz(gamma 频带)等带,报告解析信号的包络;各带阈值单独校准以保持 FDR 1%。此外还做了双极导联(减去相邻电极)复验、按类别/物体数/位置分组的复验,以及单试次解码:用线性判别分析(linear discriminant analysis,LDA)分类器,在每个至少有 20 个电极的区域内取最好的 20 个电极(best-case)或随机 20 个(average-case)构成跨被试伪群体,交叉验证解码目标出现与否(1 名被试因目标试次太少被排除)。
主要结果
-
目标调制普遍存在、空间上高度局部。744/776 个电极有可靠定位,其中 94 个(12.6%)显示目标调制,78 个位于非运动区;61/78 在双极导联下仍然显著。例电极位于左下颞回,从刺激后 212 ms 起目标出现试次的 IFP 显著更大(p<10^-14),且这一调制在五个类别中的四个、在一或两个物体的图像、在目标位于上或下位置时都成立;同一电极片上 1–2 cm 内的邻近电极既无视觉反应也无调制(图 2、3、4),提示信号是局部的、不是容积传导。
-
调制最强的区域正是物体识别相关区。宽带调制电极比例最高的区域依次为梭状回(fusiform gyrus,37.5%)、缘上回、海马旁回、下颞回和额中回(Table 1、图 7);gamma 频带中比例最高的是枕下回(44.4%)、梭状回、上顶回、额中回和缘上回。解码时间进程及作者讨论提示,梭状回和下颞回的目标信息较早且较强,额下回较晚且较弱;这是提示性区域模式。对纳入区域比较的电极级调制延迟,区域间差异未达显著(宽带p=0.17,gamma p=0.18),且临床电极采样不完整,尚不能确立区域加工层级。保留Table 1比例描述中正确的“额中回”。
-
gamma 频带的调制方向以增强为主,且与宽带调制只有部分重叠。76/744 个电极(10.2%)在 70–100 Hz 上有目标调制,其中 70 个在非运动区;它们与 94 个宽带调制电极只有 27 个重叠(35.5%,显著高于随机但仍低)。宽带及低频带中,调制方向为增大或减小的电极各占一半,而 gamma 带约 76% 的电极表现为功率增大(双侧符号检验 p=1.9×10^-5)(图 5、6)。
-
目标调制的发生时间明显晚于视觉识别信号。以调制延迟计,宽带平均 377.0±11.6 ms,gamma 带平均 383.7±13.8 ms,各区之间差异未达显著(p=0.17 与 0.18);综合多条分析,目标调制的起始在刺激后约 250 ms 之后(图 8)。而此前工作表明这些区域的视觉选择性响应在刺激后 150 ms 内即出现——两者相差约 100–150 ms,且调制远早于平均反应时 775 ms。
-
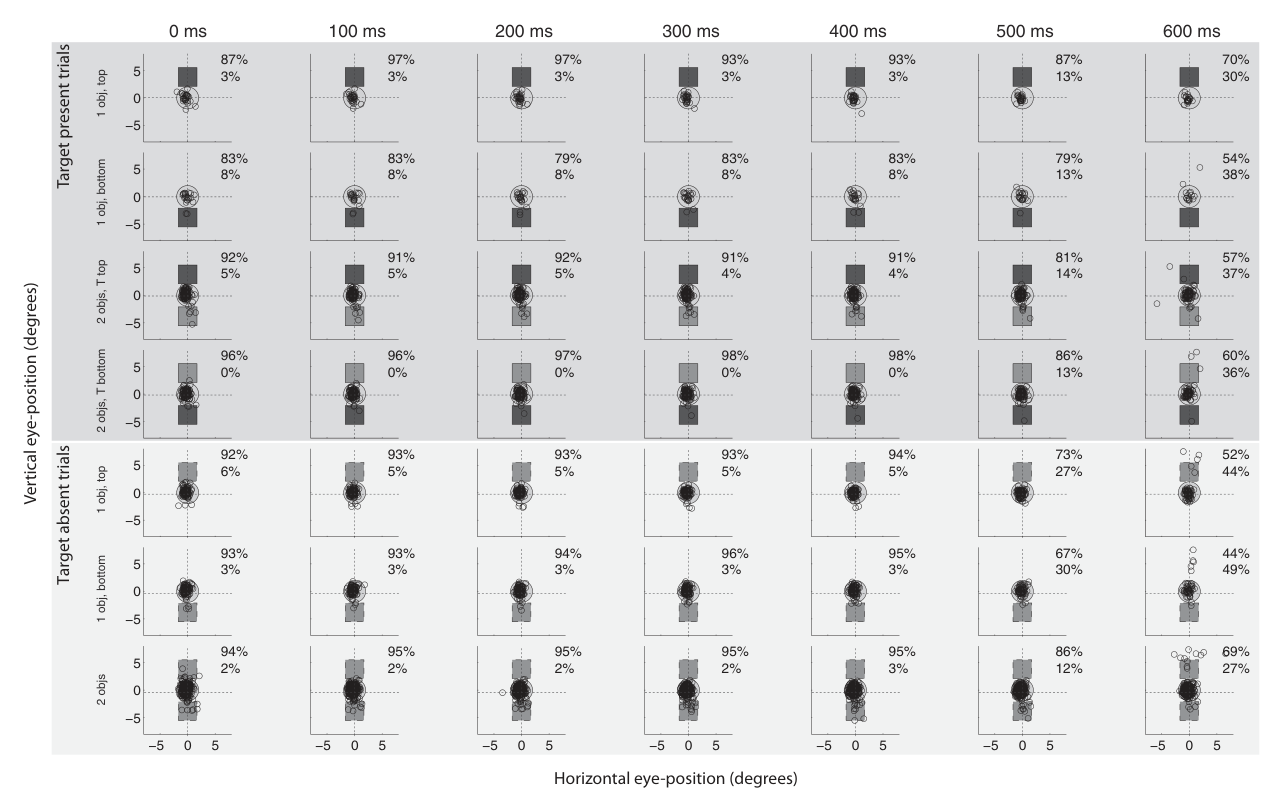
单试次即可解码目标是否出现,且不同区域时间进程不同。宽带信号中下颞回最早显著(约 275 ms)且最强(600 ms 时 77.4%),其次为梭状回(约 350 ms,69.7%)和缘上回(400 ms,71.3%);gamma 带中梭状回最早最强(约 350 ms,69.8%),其次为下颞回(约 400 ms,63.2%)和海马旁回(约 425 ms,60.8%)(图 9)。另外,两名被试的眼动追踪显示目标出现与缺失试次间眼位无差异(图 10),反应与视觉 onset 的对齐优于与按键的对齐,仅两名被试获得可靠眼动数据;在刺激后0–600 ms所检验的七个时间点,目标出现与缺失条件的水平、垂直眼位均未检测到显著差异(Wilcoxon秩和检验,均p>0.05)。非运动区效应、空间局部性、半球关系及视觉起始对齐分析共同削弱了纯运动解释,但不能完全排除眼动、反应选择或运动准备与执行的贡献。将研究思路及图10解读中的“排除”同步改为“评估并削弱相关解释”。
图注解读
图 1 · 实验设计与行为表现
原文图注:Figure1. Experiment description and behavioral performance. A, Each block of 50 trials started with a screen indicating one of five target categories (Animal, Car, Chair, Face, or House). Each trial consisted of image presentation for 100 ms followed by subject response. The image contained one or two objects presented above and/or below the fixation spot (see top left inset). There were 25 possible objects, 5 per category. In 1/3 of the trials the target category for that block was present. Subjects had 1000 ms (subjects 1–3) or unlimited time (subjects 4–10) to respond. The response was either a button press only when target was present (subjects 1–3), or two distinct buttons for target present versus target absent (subjects4–10)……
这张图是全文的任务说明书。A 面板画出试次结构:先提示目标类别,再闪现 100 ms 图像(物体在注视点上方/下方),然后被试报告;B 面板给出每名被试对目标出现(黑)与缺失(灰)试次的正确率,全体平均 92±7%,远高于随机水平;C 面板给出各类别的平均反应时,全体平均 775±299 ms。它支撑的是"任务简单、被试认真执行"这一前提,也是后文只分析正确试次的基础。
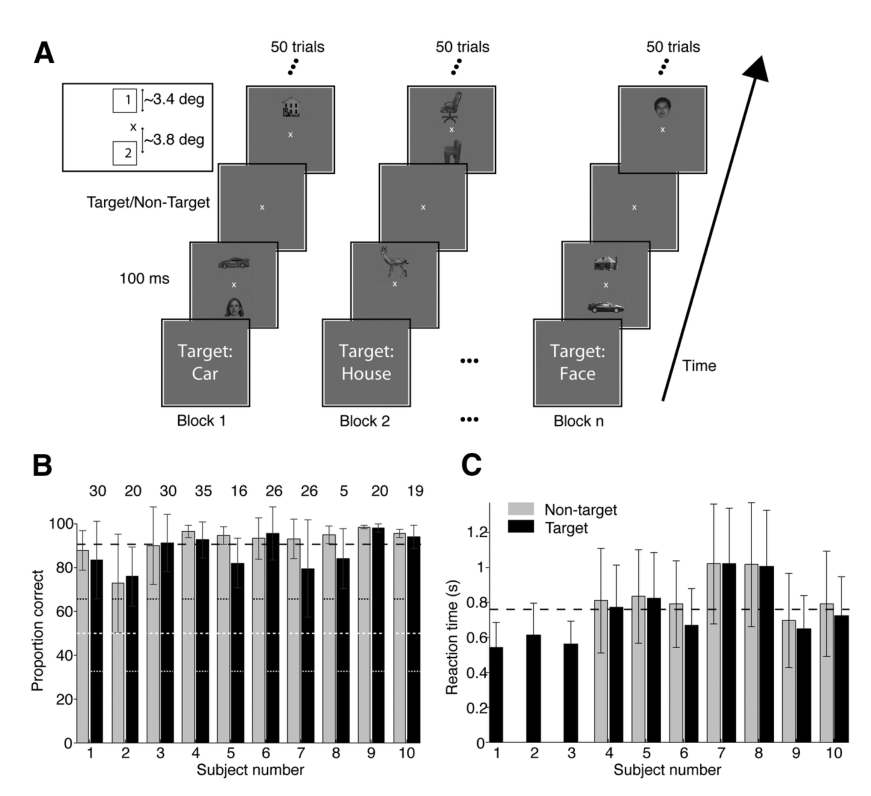
图 2 · 例电极一:下颞回的目标调制
原文图注:Figure 2. Example electrode showing differential responses between target present and target absent trials. A, Example IFP responses from an electrode located in the inferior temporal gyrus (Talairach coordinates [46.2,3.8,39.1], see G) to three individual images containing object pairs eliciting strong, moderate, or weak modulation (black, target present; gray, target absent). B, Average responses from the same electrode in the presence (black, n = 485 trials) or absence (gray, n = 1015 trials) of the target.……
这是核心现象的示范。A 面板展示单个图像诱发的原始波形,目标出现(黑)与缺失(灰)即使在单试次层面也可见差异;B 面板给出平均波形,从约 212 ms 起黑色曲线在灰色之上,粗黑横杠标记统计显著时段;C–E 面板用双极导联、按目标类别、按物体数量分组复验;F 面板显示目标在上/下位置均有调制;G、H 面板是关键的对照——同片相邻电极无此效应。它支撑结果 1:调制真实、与具体刺激属性无关、空间上局部。
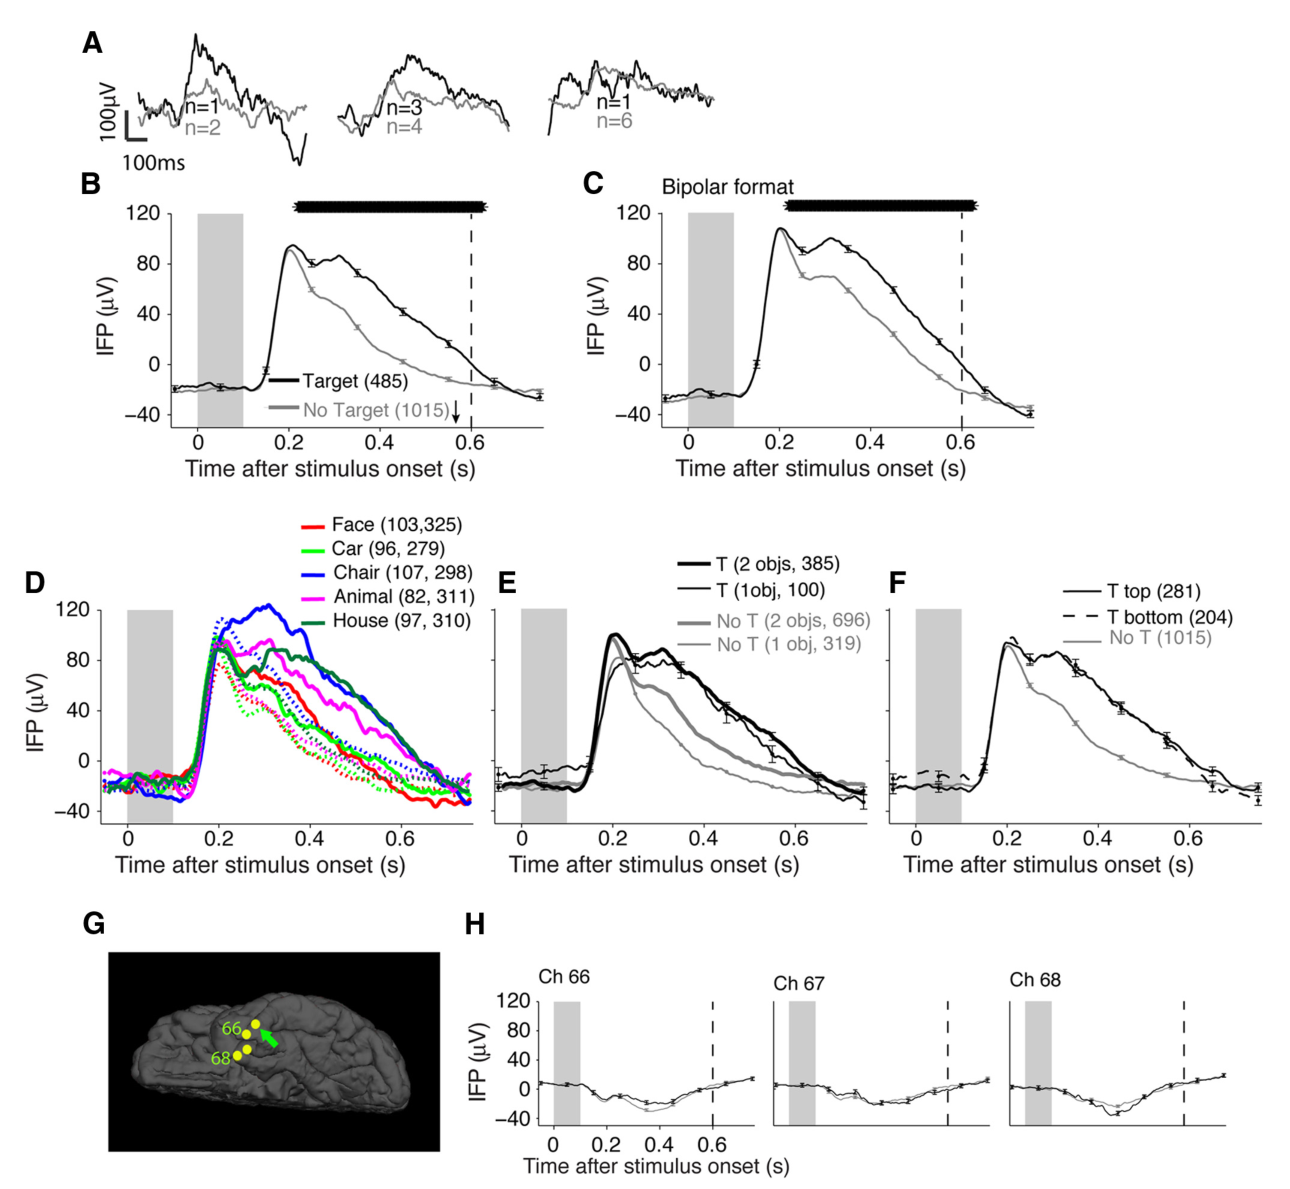
图 3 · 例电极二:梭状回的镜像现象
原文图注:Figure 3. Second example electrode. Responses from a second example electrode located in the left fusiform gyrus (Talairach coordinates [29.8,43.1 17.3]). The format and conventions are as in Figure 2. A, Average responses from the same electrode in the presence (black, n = 303 trials) or absence (gray, n = 697 trials) of the target. B, The same responses are shown in a bipolar montage. C, The same responses are plotted separately for each of the five categories. D, Responses separated based on whether the image contained one object (thin lines) or two objects (thick lines). E, Responses separated based on whether the target was in the top (solid line) or bottom (dashed line) position. F, Electrode location (arrow) and location of seven other electrodes on the same strip. G, Responses from the other seven electrodes on the same strip (format as in A).
第二例电极位于左梭状回,与图 2 互为印证,但方向相反:目标出现试次的平均 IFP 显著更负,且五个类别全部显著。单/双物体、上/下位置的分组以及邻近电极对照的结论同图 2。它说明目标调制不是某个电极的偶然现象,在腹侧流的另一关键区域以另一种极性同样成立。
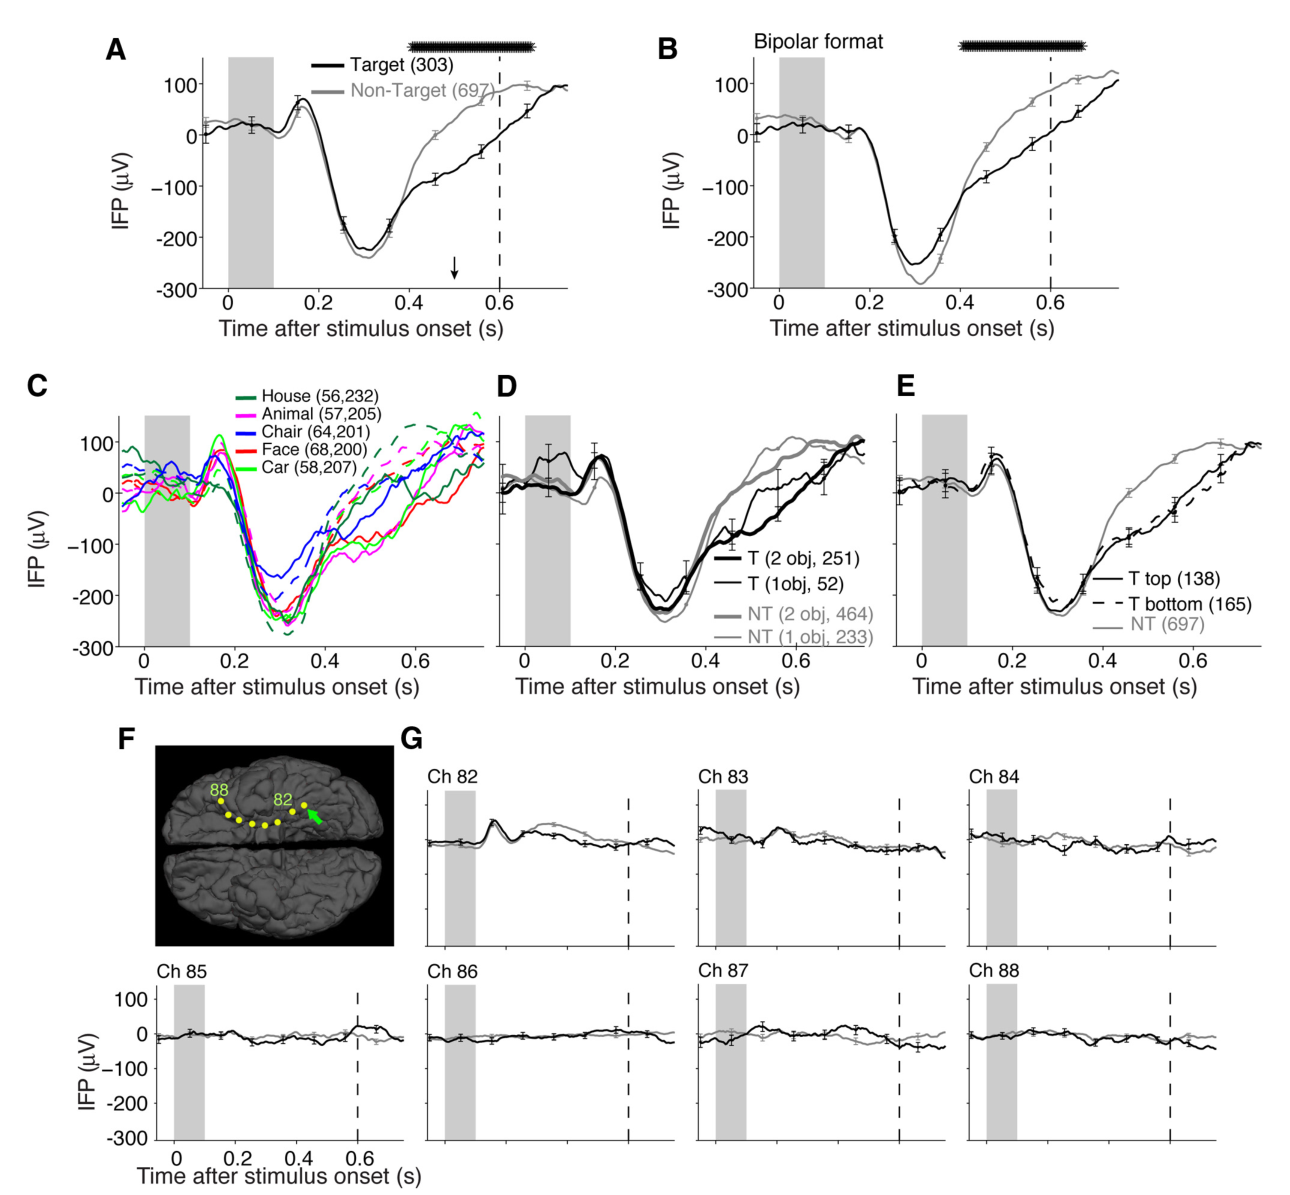
图 4 · 全部调制电极的平均反应
原文图注:Figure4. Responses of all target-modulated electrodes. Mean (±SEM) IFP responses, normalized by dividing by the maximum voltage, for target present (black) versus target absent (gray) trials for all the non-motor electrodes that showed target modulation in correct trials. The baseline IFP response (mean IFP between 50 and 0 ms before stimulus onset) was subtracted from each electrode's mean IFP response. Negative voltage responses (e.g., Fig.3B) were reflected with respect to the y-axis before normalization…… A, Electrodes above the diagonal in Figure 6A (n = 56, where power in target present trials > power in target absent trials). B, Electrodes below the diagonal in Figure 6A (n = 22, where power in target present trials < power in target absent trials)……
这张图把 78 个非运动区调制电极的波形叠画在一起:A 面板是目标出现时反应增大的 56 个电极,B 面板是减小的 22 个电极。所有曲线先减基线、再除以最大值归一化,负向反应先对 y 轴取镜像以便平均。它直观呈现结果 1 的群体层面:无论调制方向如何,差异都集中在视觉诱发响应之后的时段,而且增、减两类电极都真实存在——这也是后文讨论宽带信号调制方向不定的伏笔。
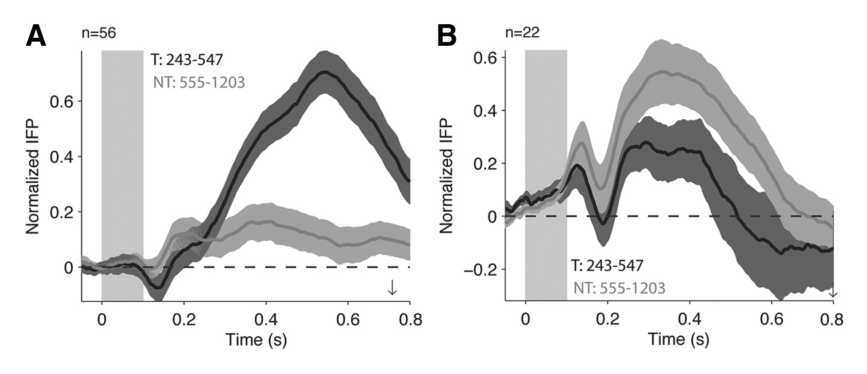
图 5 · gamma 频带的例电极
原文图注:Figure 5. Example electrodes showing differential responses between target present and target absent trials in the gamma frequency band. Three example electrodes located in the inferior temporal gyrus (A, Talairach coordinates [57.4 8.5 10.9]), inferior occipital gyrus (B, [49,84.5,1.4]), and fusiform gyrus (C, [48.6,32.6,9.2]) showing responses in the gamma frequency band during target present (black) and target absent (gray) trials. The format and conventions follow those in Figure 2B except that here the y-axis represents the envelope of the IFP signal in the 70–100 Hz frequency band (see Materials and Methods). The mean reaction time (arrow) in A and C was after 800 ms.
格式与图 2B 相同,只是纵轴换成了 70–100 Hz 信号的包络。三个例电极(下颞回、枕下回、梭状回)都在目标出现试次表现出 gamma 功率的升高。它支撑结果 3 的"现象存在"一面:gamma 带调制可重复,且鉴于 gamma 功率常被视为与神经元放电活动相关,这提示目标检测伴随局部加工的增强。
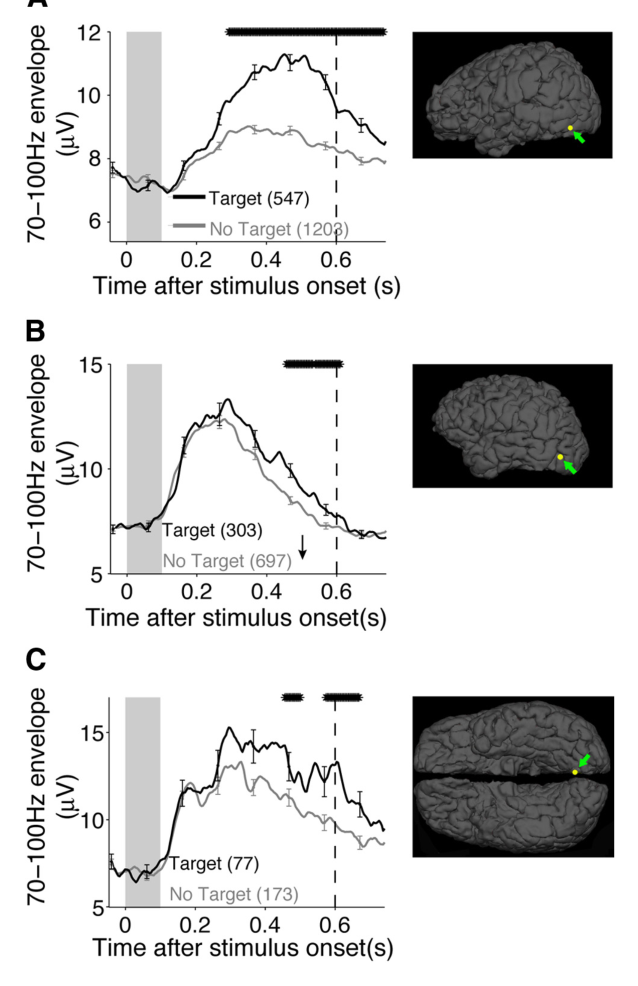
图 6 · 七个频带的调制方向比较
原文图注:Figure 6. Comparison of responses for target present versus target absent trials in seven frequency bands. Normalized root-mean squared power (average response from 200 to 550 ms after stimulus onset, normalized by the maximum value) for broadband signals (A) and six different frequency bands (B–G) in target present trials (y-axis) versus target absent trials (x-axis). Each circle denotes a separate electrode that showed target modulation. Error bars indicate 1SEM. The diagonal line represents equal response for target present and target absent trials. A two-sided sign test determined significant asymmetry in the distribution of the points across the diagonal for the 4–8, 8–12, 35–50, and 70–100 Hz bands……
这是结果 3 的定量核心。每个频带一幅散点图:横轴为目标缺失试次的归一化功率,纵轴为目标出现试次的功率,对角线代表两者相等;点落在对角线上方即目标出现时功率更大。宽带(A)与低频带(B)的点均匀分布在对角线两侧,而 70–100 Hz(G)中约 76% 的点在上方(符号检验 p=1.9×10^-5)。"x"标记来自打乱试次标签的对照,给出随机偏离对角线的期望幅度。这张图确立了"宽带增减各半、gamma 以增强为主"的关键对比。
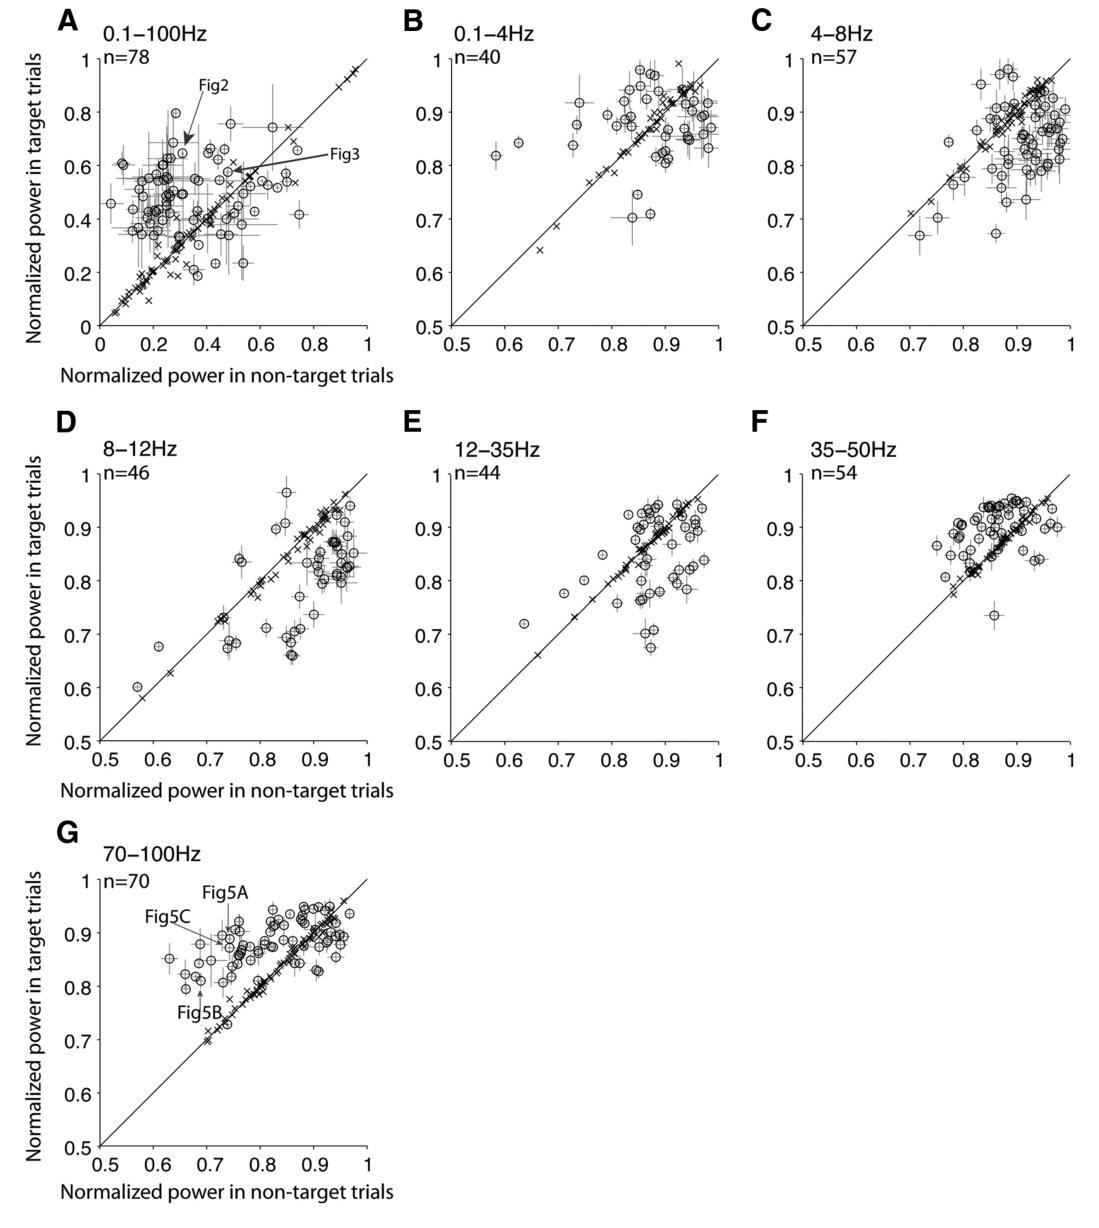
图 7 · 调制电极的解剖分布
原文图注:Figure 7. Electrode locations. Lateral view showing the location of sampled electrodes (black), electrodes in regions that showed modulation by target presence in both broadband and gamma band signals (yellow), electrodes in regions that showed modulation by target presence predominantly in broadband signals (blue), and electrodes in regions that showed modulation by target presence predominantly in gamma band signals (red). Only regions with 5 electrodes showing target modulation are shown in this figure (Table 1). All electrodes were mapped onto one subject's brain (subject 10) and reflected onto the left hemisphere for this illustration.
把所有电极投影到同一被试(被试 10)的左半球侧视图上:黑色为采样电极,黄色为宽带与 gamma 双重调制的区域,蓝色为以宽带调制为主的区域,红色为以 gamma 调制为主的区域。它支撑结果 2:调制集中在腹侧视觉流(梭状回、下颞回)及顶叶、前额叶的相关区域,且不同区域在频带偏好上有所分化——例如下颞回偏宽带、上顶回与枕下回偏 gamma。
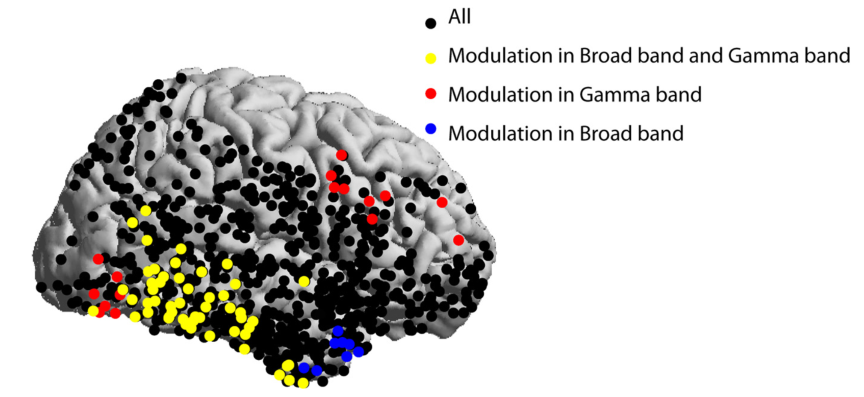
图 8 · 调制延迟的分布
原文图注:Figure 8. Differentiation between target present and target absent responses started after 250 ms poststimulus onset. For each electrode that showed a differential response between target present and target absent trials, we defined the target modulation latency as the first time point when a two-tailed t test between target present and target absent trials yielded p < 0.01 for at least 70 consecutive ms (FDR < 0.01; see Materials and Methods). The plots show the distribution of latencies using the broadband power (A, n = 78 electrodes) or the gamma power (B, n = 70 electrodes). The inverted triangles indicate the mean. The arrowheads indicate the examples from Figures 2, 3, and 5. Bin size = 50 ms. C, D, Mean (±SEM) target modulation latency in each region……
A、B 两面板分别是宽带与 gamma 带的延迟直方图:分布从约 250 ms 之后才展开,均值分别约 377 与 384 ms(倒三角标记),最早也晚于视觉选择性响应的出现时间;箭头标出图 2、3、5 中例电极的位置。C、D 按区域给出平均延迟,各区差异未达显著。它支撑结果 4——本文最核心的数字:目标调制晚于识别信号约 100–150 ms。
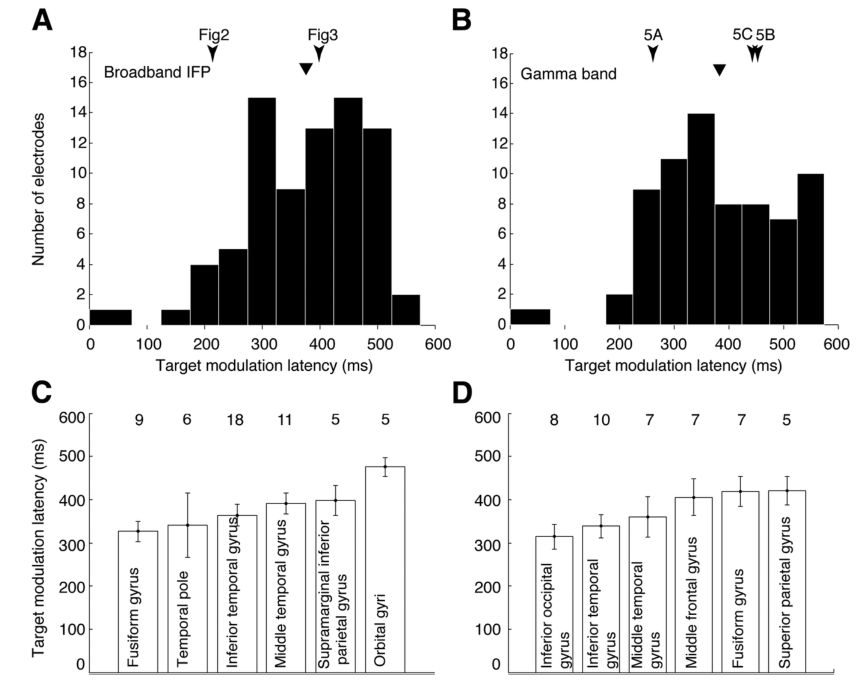
图 9 · 单试次解码的时间进程
原文图注:Figure 9. Single-trial discrimination between target present and target absent trials. Decoding performance using the best 20 electrodes (A, B) or 20 random electrodes (C, D) in each of 10 regions with at least 20 sampled electrodes across nine subjects (see Materials and Methods). A linear discriminant analysis classifier was used to decode whether the target was present or absent in any given trial. At each time point t on the x-axis, the broadband (A, C), or gamma band (B, D) signals in the interval [50,t] ms were used for classification. The classification performance reported on the y-axis is obtained from cross-validated test data. Error bars indicate 3 SEM. The 20 best electrodes were selected using only training data. The gray shaded region indicates chance levels……
纵轴是交叉验证的解码正确率(50% 为随机),横轴是用于分类的数据窗口右端点 t;A、C 用宽带,B、D 用 gamma;A、B 用每区域最好的 20 个电极,C、D 用随机 20 个电极以校正采样偏倚。下颞回在宽带下最早显著(约 275 ms)且 600 ms 时达 77.4%,梭状回在 gamma 下最早(约 350 ms,69.8%)。它支撑结果 5:目标信息在单试次层面可读出,且不同区域的解码起始与强度构成一个候选的加工层级。
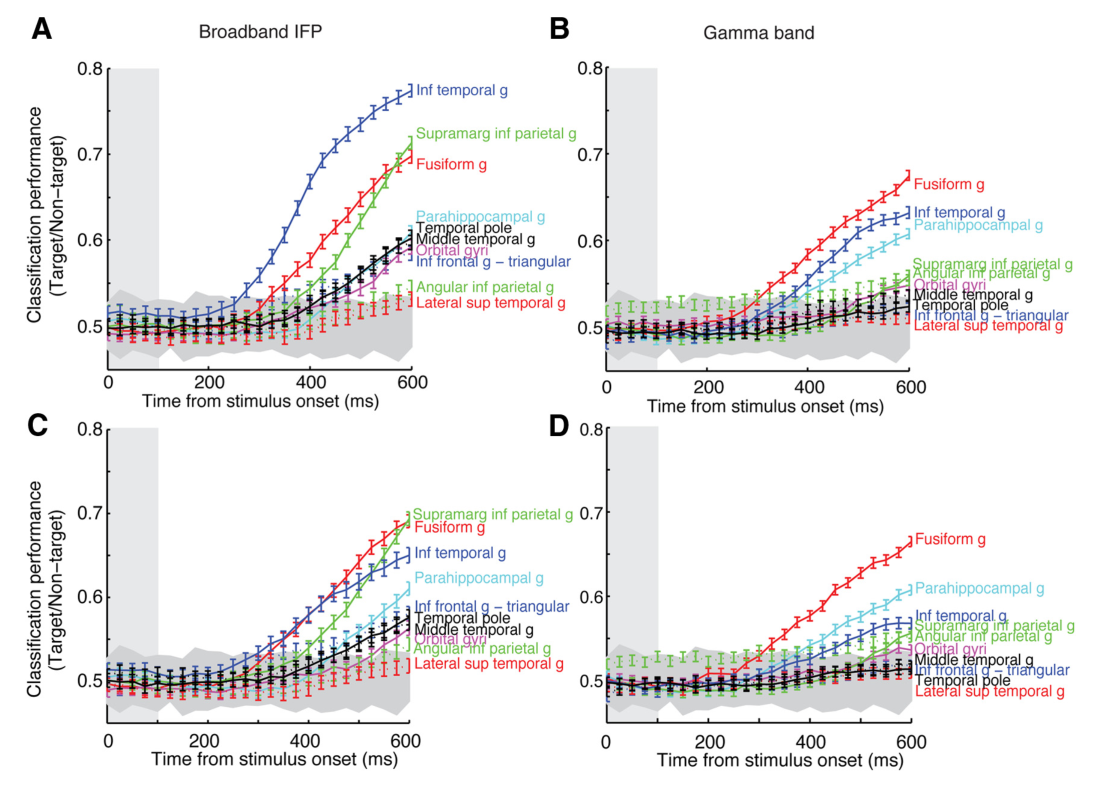
图 10 · 眼动对照
原文图注:Figure 10. Eye position was similar in target present and target absent trials. Eye position as a function of time from stimulus onset for subject 10. Each small circle denotes the eye positions (horizontal in x-axis and vertical in y-axis) during each trial in 100 ms intervals from the time of stimulus onset (first column) to 600 ms after stimulus onset (seventh column). The top four rows represent target present trials. The top two rows represent trials where only one object was presented (dark gray squares represent target location) above (row1) or below (row2) the fixation point……
这是排除解释的关键对照。每格是某一时段内所有试次的眼位散点(横轴水平眼位、纵轴垂直眼位),上四行为目标出现试次(按物体数与目标位置分组),第 5–7 行为目标缺失试次;大方圈是半径 2° 的注视窗。格内数字给出注视落在窗内的试次比例:刺激后前 500 ms 内绝大多数试次保持在注视窗内,且目标出现与缺失试次之间无系统差异。它支撑结果 5 中排除眼动解释的那一半。
讨论
作者把发现总结为一个两过程分离的框架:早期自下而上的信号在刺激后约 150 ms 内已能判别图像特征,而涉及目标检测的晚期自上而下信号要到约 250 ms 之后才出现,两者相差约 100–150 ms。这个延迟量级与猴 V4 和 ITC 在视觉搜索任务中的经典发现(Chelazzi 等,1993/1998/2001)一致——猴的单细胞记录显示,目标是否为该神经元偏好刺激的调制比视觉选择性信号晚约 100 ms,虽然绝对延迟因物种、区域、任务和电极不同难以直接比较。作者推测调制可能来自前额叶等区域的自上而下影响,且任务很可能调用了基于特征的注意(feature-based attention)——因为目标位置在试次间随机化,空间注意无法提前部署,图像又在 100 ms 内消失。
作者也坦白了几点局限:电极采样远非全面,数据不能指认目标调制的最早起源;不能完全排除运动准备的解释(尽管四条证据——非运动区电极、空间局部性、同侧半球的调制、对齐视觉 onset 优于对齐按键——都反对纯运动解释);各区延迟差异不显著可能只是每区电极数太少。关于频带差异,作者猜测宽带信号可能反映更大范围神经元输入的突触后电位总和,而 gamma 带可能反映局部计算,但承认其生物物理机制仍待研究。全文的落点是一句有分量的判断:人类下颞皮层并非只装着一个被动的、容变的物体表征,而是被任务需求主动调制的。
一句话总结
这篇文章最打动我的地方在于用一个干净的任务设计(同一图像在目标出现/缺失两种情境下重复出现)把"看见"与"为任务而看"在时间轴上拆开了:识别先行,目标归并在 100 多毫秒之后才介入,而且恰恰落在识别网络的心脏地带。gamma 带以增强为主、宽带增减各半的对比也提醒我们,不同频带的场电位讲的可能是两个不同的故事。这是我基于文本的理解——文中区域间延迟差异未达显著,所谓"层级"的说法作者自己也承认只是线索。
审校与证据追溯 (Verification & Evidence)
图表审计结果
- Fig1: 提取质量
good,对齐度full,识别面板[A] - Fig10: 提取质量
good,对齐度full,识别面板[] - Fig2: 提取质量
good,对齐度full,识别面板[A, B, G] - Fig3: 提取质量
good,对齐度full,识别面板[A, B, C, D, E, F, G] - Fig4: 提取质量
good,对齐度full,识别面板[A, B] - Fig5: 提取质量
good,对齐度full,识别面板[A, B, C] - Fig6: 提取质量
good,对齐度full,识别面板[A, G] - Fig7: 提取质量
good,对齐度full,识别面板[] - Fig8: 提取质量
good,对齐度full,识别面板[A, B, C, D] - Fig9: 提取质量
good,对齐度full,识别面板[A, B, C, D]
关键事实与局限性声明
- 审校纠偏: {'classification': 'OVERCLAIM', 'claim': '目标出现与缺失条件的差异只能归因于自上而下目标信号。', 'assessment': '不成立。数据支持任务依赖性调制,但不能唯一识别其因果来源。'} -> 评注: 不成立。数据支持任务依赖性调制,但不能唯一识别其因果来源。
- 审校纠偏: {'classification': 'OVERCLAIM', 'claim': '眼动和纯运动解释已被排除。', 'assessment': '不成立。相关控制削弱了这些解释,但眼动仅在两名被试中测量,作者也明确承认不能完全排除运动解释。'} -> 评注: 不成立。相关控制削弱了这些解释,但眼动仅在两名被试中测量,作者也明确承认不能完全排除运动解释。
- 审校纠偏: {'classification': 'OVERCLAIM', 'claim': '实验直接证明了自下而上识别先于自上而下目标检测。', 'assessment': '应降级为作者推论。实验直接支持的是早期视觉反应与较晚目标相关调制之间的时间差。'} -> 评注: 应降级为作者推论。实验直接支持的是早期视觉反应与较晚目标相关调制之间的时间差。
- 审校纠偏: {'classification': 'OVERCLAIM', 'claim': '不同区域的时间进程构成目标检测加工层级。', 'assessment': '只能作为候选解释;区域延迟差异未显著,采样不完整,伪群体解码也不能证明信号传播方向。'} -> 评注: 只能作为候选解释;区域延迟差异未显著,采样不完整,伪群体解码也不能证明信号传播方向。
- 补充要点: : (第 5 页)
- 补充要点: : (第 2 页)
- 补充要点: : (第 7 页)
- 补充要点: : (第 9 页)
- 补充要点: : (第 5 页)