IT Literature Intelligence 终审版本 (VERIFIED) 论文编号:
291| 原始基线:V0_ZCODE_BASELINE| 语义审核:pass| 图表审核:passAstra裁决:compromise_revision(revise)
Color signals through dorsal and ventral visual pathways
Conway · Visual Neuroscience · 2014 · Zotero itemID=2467
这篇综述围绕一个尖锐的方法论问题展开:把"S 视锥激活引起反应"当作"该脑区参与颜色知觉"的证据,到底可不可靠?作者梳理了 S 视锥信号沿背、腹两条视觉通路的加工(重点对比运动区 MT 与 V4/后下颞皮层),并补充了清醒猕猴 fMRI 的原始数据。它值得读,是因为作者给出了一个简洁的替代假说——非颜色脑区中的 S 信号不是在编码色调,而是在提供"光照"线索(阴影由天光呈蓝、日光区呈黄),从而把 MT 的颜色敏感性和 S 视锥系统的一系列谜题一并纳入解释。
研究背景
颜色现象的解释通常在视网膜、外侧膝状体(lateral geniculate nucleus, LGN)和 V1 中寻找,但作者开篇列出四个难题说明这一策略已经碰壁。其一,LGN 神经元颜色拮抗强烈,但其拮抗方式并不对应 Hering 的基本对立色对(红-绿、蓝-黄),且群体调谐强烈偏向"红-青"与"薰衣草-青柠",几乎没有最优调谐到蓝、绿、紫、黄的细胞。其二,LGN 细胞的空间拮抗构型恰好与颜色对照机制所需相反:"红-开"细胞的最优刺激是暗红背景上的亮红,而非绿背景上的红。其三,S 视锥仅占视锥总数的约 10%,却能强烈驱动 V1 活动。其四,V1 颜色细胞对 S 视锥分离刺激的反应在空间与符号上通常与 M 视锥反应对齐——而早年普遍认为 S 输入应与 L 输入对齐,以解释短波长光的"偏红"特性(Ingling 1977)。这些失败共同指向:色调及其他颜色现象的计算必须发生在 LGN 和 V1 之后的脑区。
与此同时,追踪 S 信号进入纹外皮层的工作挑战了一个流行假设——"S 视锥反应=颜色信号"。S 视锥信号已在 MT 这样公认与颜色知觉关系不大的脑区被发现(Gegenfurtner 等 1994;Seidemann 等 1999;Wandell 等 1999 等),且很可能大多数乃至全部纹外区都受 S 视锥刺激激活。于是概念上的关键区分浮出水面:对颜色的敏感性(sensitivity,能对颜色边界有反应)与对颜色的选择性(selectivity,对色调本身有调谐)是两回事,前者广泛存在,后者相对稀少。缺口在于:既然 S 信号遍地都是,哪些反应真正参与颜色知觉的计算、哪些另有用途,尚无系统答案。
研究思路
作者的总体策略是"沿通路追踪 + 跨区对比 + 概念分流"。纵向上,把同一组颜色刺激(定义于 DKL 锥拮抗空间的等亮度异色光栅)依次施加于视觉加工的各个阶段——LGN、V1、MT、以及 V4/后下颞皮层(PIT)中偏色与不偏色的区域——比较响应随通路的变换;横向上一并引用单细胞记录、逆行示踪解剖与人类/猕猴 fMRI 的证据。概念上,作者先立起"敏感性/选择性"的二分,再用两个形式化模型(群体编码 population code 与区间编码 interval code,借自 MT 运动感知研究)刻画颜色表征如何从皮层下的锥拮抗坐标转变为皮层的知觉色轮坐标。S 视锥信号的功能就这样被拆成两问:在颜色计算区(PIT 颜色偏置区),它是把表征扩展到蓝色端、实现知觉色彩空间均衡表示所必需的;在非颜色区(MT、PIT 间隔区),它提供的是与亮度对比脱钩的"光照"线索——天然日光下阴影由环境天光照亮而偏蓝、被直射阳光包围的区域偏黄,对这种色轴边界的敏感性有利于"从阴影提取形状"(shape-from-shadow),服务于全局场景分析与运动知觉。
方法
本文是综述,原始数据来自作者与 Lafer-Sousa 等在清醒猕猴上完成的 fMRI 实验(Lafer-Sousa 等 2012 实验 1)。刺激为异色光栅(空间频率 2.9 周/度,以 0.75 周/秒缓慢漂移、每 2 s 反转方向),颜色方向取自 DKL 锥拮抗空间等亮度平面上的四个轴:红-绿(L-M)、蓝-黄(S 轴)、橙-青(日光轴)与青柠-品红(正交中间轴),各条件的视锥对比度由文中表 1 给出(如红-绿条件 L/M/S 对比分别为 0.065/0.127/0.002、总对比 0.194;蓝-黄条件 S 对比高达 0.784、总对比 0.803)。关键控制在于:两条中间轴对底层主轴(L-M 与 S)机制的激活程度相同,故任何响应差异都不能归因于底层通道的激活总量。在单细胞层面,引用的记录多在清醒猕猴上进行(V1 双拮抗细胞的空间映射用稀疏噪声锥分离刺激加反相关法;PIT glob 细胞用微电极沿 fMRI 引导的穿刺轨迹记录),并对猴与人的视前媒介色素差异、色差(chromatic aberration)引起的亮度伪影等混淆保持 explicit 讨论。fMRI 可同时测量多个脑区,正好适合比较同一颜色信号在不同阶段的命运。
主要结果
- MT 对颜色敏感但不对色调选择性。MT 神经元对等亮度运动刺激的反应低于有亮度对比的刺激("MT 色盲"的行为学依据),但 Dobkins 与 Albright 证明无亮度线索时残余颜色信息仍足以驱动 MT 神经元;红-蓝光栅亮度交换实验中 MT 的 BOLD 响应在光度等亮度点附近出现凹陷却未消失(Conway 与 Tsao 2006)。然而没有任何 MT 神经元表现出对亮度对比变化耐受的色调选择性(Conway 等 2007)——"颜色敏感性"与"颜色选择性"的区分正源于此。
- S 信号进入 MT 有解剖通路且疑似双因素驱动。Seidemann 等(1999)在清醒猴记录到 MT 神经元对 S 视锥分离刺激有反应(低空间频率刺激减轻了色差问题),人类 fMRI 也支持(图 3:MT 的亮度响应约为 V1 的 6 倍,S 响应约为 V1 的 2 倍);Sincich 等(2004)向 MT 注射逆行示踪剂,发现 LGN 粒状细胞层(koniocellular layers,普遍认为携带强 S 信号)中有被标记、且绕过 V1 直接投向 MT 的神经元(图 4)。但作者也承认证据链有缺口:麻醉猴研究只找到极弱的 S 响应,MT 投射神经元的生理特性未被描述;且 MT 对蓝色等亮度条的强反应在加亮度基座后大幅减弱,提示色差伪影与真 S 输入可能"两者都有"。
- 从 LGN 到 V1 到纹外区,"日光轴偏置"逐步形成(图 5、6)。LGN 的群体调谐呈两个峰(对齐 L-M 与 S-(L+M) 主轴),日光轴偏置不明显;V1 群体响应沿橙-青(日光)轴显著强于正交的青柠-品红轴(图 5),由于两轴对主轴机制的激活相同,这提示由主轴机制非线性组合生成的非主轴颜色机制在 V1 出现;MT 的偏置强于 LGN 但弱于 V1(图 6B);PIT 中不偏色的间隔区(PITi)呈显著的日光轴偏置(图 6C)。
- PIT 颜色偏置区(globs)发生关键变换:对 S 轴的相对增益最高、色调选择性变尖锐(图 6D、8、10)。glob 细胞对锥分离刺激的反应只有在细胞颜色偏好与分离刺激颜色对齐时才强(图 8),且一个绿色调谐细胞对 M+、L-、S- 产生的绿色一视同仁——这与 V1 锥拮抗细胞"S 与 M 对齐"的模式截然不同,说明在 V1 与 PIT 之间颜色表征已从锥拮抗空间变换为基于色调(知觉)的空间;其 S 轴响应的相对增强使色轮四周的表征更均衡,是与颜色知觉关系最密切的指标。用密集采样 DKL 空间的刺激初步测得:glob 细胞的调谐对亮度与饱和度变化都耐受,且饱和度可能由反应潜伏期编码(饱和度越低潜伏期越长,图 10)。
- 颜色调谐细胞按"色位图"(chromatopic maps)聚集(图 9)。沿电极穿刺,相邻细胞色调偏好相似且按色轮次序系统漂移(红之后橙、紫),偏离该组织的"离群"细胞恰好反应潜伏期更长——作者猜测这与细胞感受野的空间拮抗结构(类似 V1 双拮抗细胞)被刺激激活了外周有关。该组织得到光学成像(Tanigawa 等 2010)支持。
- 非颜色区的 S 敏感性服务于光照与场景结构(图 7)。S 通道在视网膜上天生模糊(S 视锥少、眼对黄聚焦),无法贡献高敏锐度;携带 S 信号的节细胞恰是区分"白/灰(岩石)与黄(土壤)"的最优通道。日光场景中阴影偏蓝、日照区偏黄(莫奈惯用蓝画阴影),这类色轴边界是三维几何的有力线索;从场景(而非抓取距离)观察时,含阴影场景的蓝-黄分量富集低空间频率,正好匹配 S 系统的低通特性——作者以此化解"视觉系统应优化于自然场景却对不上"的悖论,并解释 MT 的 S 敏感性。
图注解读
图 1 · 背腹双通路示意图
原文图注:Figure 1. Simple schematic of the brain showing the visual pathway from the retina, through the dorsal lateral geniculate nucleus of the thalamus (LGN), up to primary visual cortex (V1). From V1, through intermediate visual areas (V2, V3, V4, not labeled), two major routes have been described, a dorsal pathway through MT (and related areas), and a ventral pathway through posterior, central and anterior inferior temporal (IT) cortex. The dorsal pathway has been implicated in encoding dynamic spatiotemporal relationships among visual objects (object action), while the ventral pathway is thought to represent stable attributes of objects (object quality)(DiCarlo et al., 2012; Kravitz et al., 2012). S-cone activation drives responses within both dorsal and ventral pathways. IT contains regions that are relatively more responsive to color (one such region is shown hatched in PIT).
这是一张路线图:视网膜经丘脑 LGN 到 V1,再分出经 MT 的背侧通路与经后/中/前下颞皮层的腹侧通路;背侧编码物体间的动态时空关系("物体行动"),腹侧表征物体的稳定属性("物体质量")。PIT 中画斜线的区域标出相对更响应颜色的部位。读这张图是为了把全文的坐标固定下来——S 视锥激活同时驱动两条通路,本文要问的正是这些 S 信号在两条通路上各干什么。
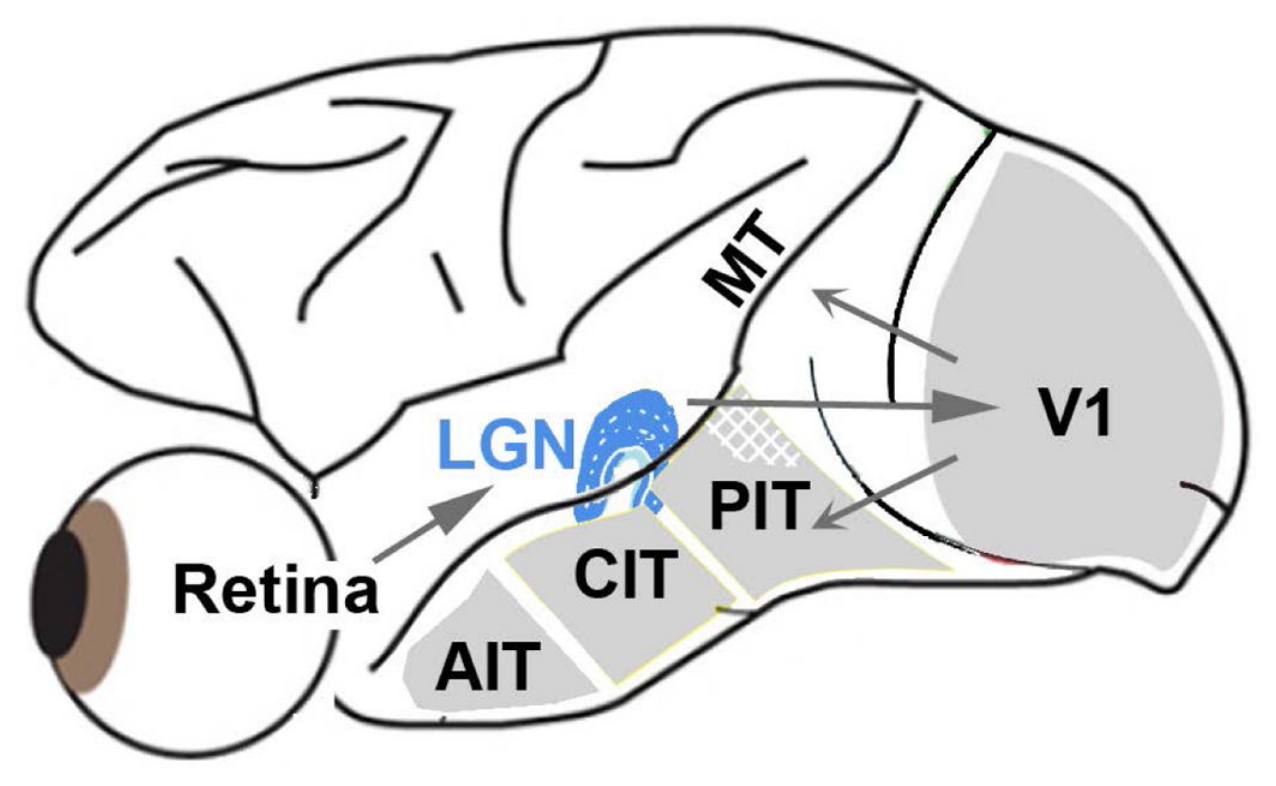
图 2 · V1 双拮抗细胞的锥体输入空间结构
原文图注:Figure 2. Spatial organization of cone inputs to a double-opponent cell recorded in alert macaque primary visual cortex. A, Spatial receptive-field map generated using sparse noise cone-isolating stimuli and reverse correlation. Scale of the small divisions on the grid is 0.75° of visual angle. The receptive-field center of the cell was activated by the "+" direction of the L-cone stimulus and the "-" direction of the M-cone stimulus, both of which appear reddish, but also by the "-" direction of the S stimulus, which appears lime. Note that the colors associated with the optimal polarity for each of the three cone-isolating stimuli do not fall in the same category, undermining the claim that the neuron contributes directly to hue. The inset gives an indication of the color of each stimulus (although the actual stimuli were presented on a computer monitor and carefully color calibrated). A "+" stimulus causes a selective increase in activation of the given cone type (compared to the activation generated by the adapting background); a "-" stimulus causes a selective decrease in cone activation. B, Spike-triggered average traces. The receptive-field center (central region in panels, A) was excited by an increase in L-cone activity (L+) or a decrease in M or S activity (M–, S–), and suppressed by a decrease in L (L–) or an increase in M or S (M+, S+); the receptive-field surround gave the opposite pattern of responses. Data from (Conway, 2001; Conway & Livingstone, 2006).
A 部分是用稀疏噪声锥分离刺激加反相关得到的感受野空间映射(网格每格 0.75° 视角):感受野中心被 L+(偏红)、M-(偏红)与 S-(偏青柠色)激活。关键在于三种最优极性对应的颜色不属于同一类别——S- 是青柠色而 L+/M- 偏红,这对"该细胞直接编码色调"的说法是致命一击,也是背景里第四个谜题的图示。B 部分的发放触发平均迹给出中心-外周的对偶模式(中心被 L+、M-、S- 兴奋、被 L-、M+、S+ 抑制,外周相反),说明这是一个空间上双拮抗、负责颜色对照计算的细胞,而非色调检测器。
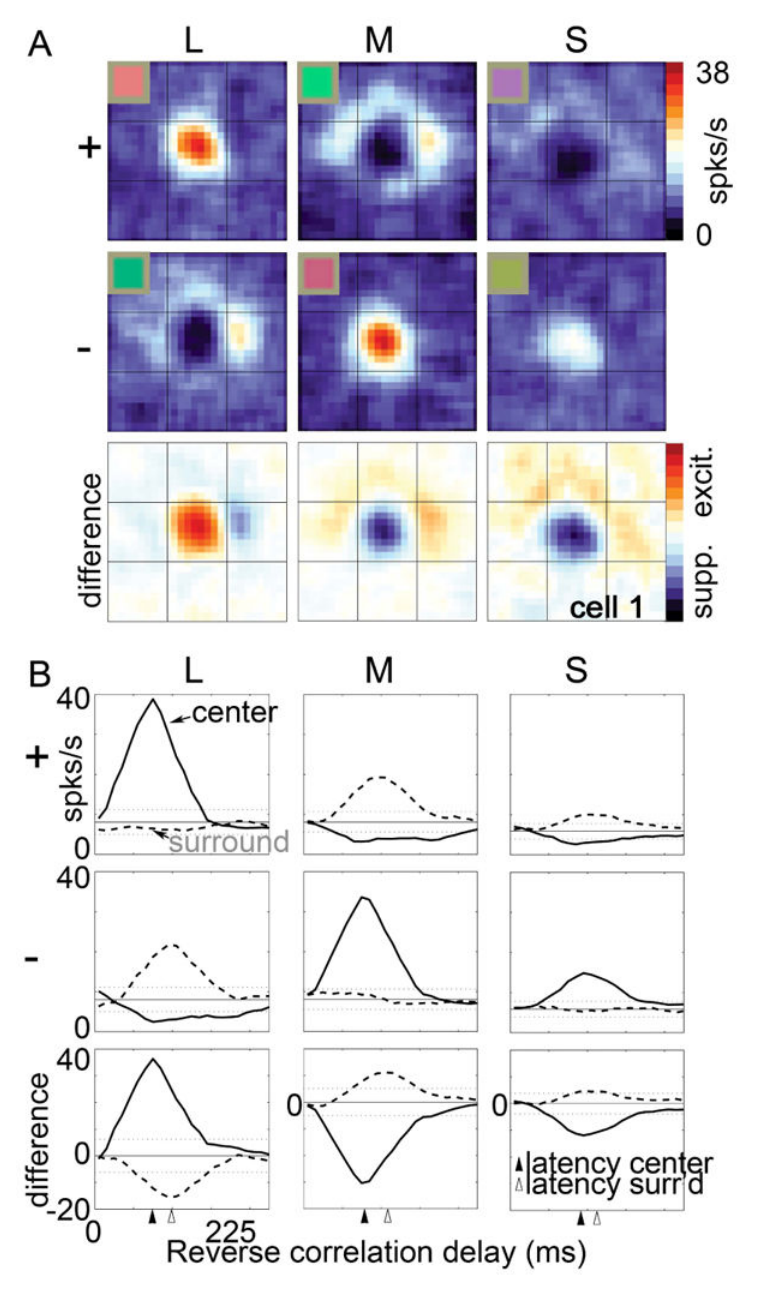
图 3 · 人类 fMRI:V1 与 MT 对亮度与 S 视锥刺激的响应
原文图注:Figure 3. Responses measured with fMRI in human subjects to stimuli with luminance contrast (squares) or S-cone contrast (diamonds). A, V1 responses. B, MT responses. The shape of the S-cone response function in V1 is not a scaled version of the luminance response, consistent with the conclusion that the response to the two stimuli are mediated by different underlying neural components (i.e. the S-cone responses is not just driving the luminance channel weakly). Luminance responses in MT are ∼6X greater than luminance responses in V1; S-cone responses in MT are ∼2X greater than those in V1. From (Wandell et al., 1999).
两个面板分别画 V1 与 MT 的 BOLD 响应函数,横轴为刺激对比度,方块为亮度对比刺激、菱形为 S 视锥对比刺激。读图要点有二:其一,V1 的 S 响应函数不是亮度响应函数的缩放版,说明二者由不同神经成分介导,S 响应并非"微弱的亮度通道驱动";其二,MT 的亮度响应约为 V1 的 6 倍而 S 响应只约为 V1 的 2 倍——MT 对亮度远比对 S 信号敏感,这为"S 信号进 MT 但用途不是色调"提供了定量背景,对应结果第 1、2 条。
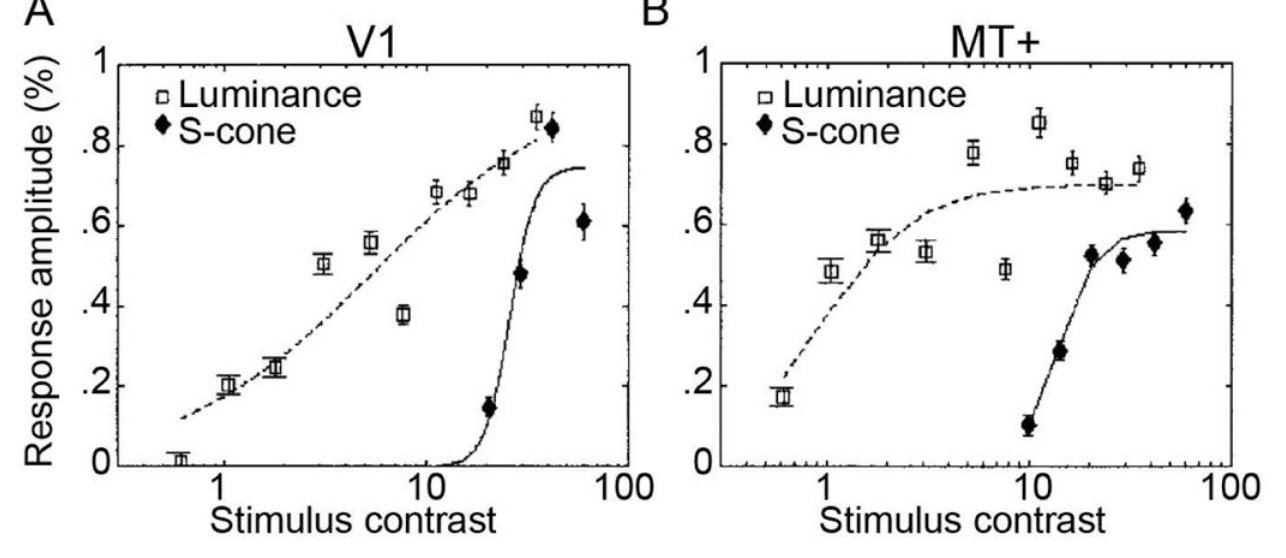
图 4 · LGN 粒状细胞层向 MT 的直接投射
原文图注:Figure 4. Neurons in macaque LGN identified after retrograde tracer injection in area MT and V1. A, Low-power of a slice through the entire LGN showing MT-projecting cells in red and V1-projecting cells in black. B, High-power of the boxed region in A. MT-projecting cells labeled in blue; V1-projecting cells labeled in brown. Note the two MT-projecting neurons that are conspicuously not double-labeled, showing that the axons of these neurons project directly to MT and bypass V1. MT-projecting neurons appear to be located preferentially within the koniocellular layers of the LGN, which are thought to carry strong S-cone signals. Data from (Sincich et al., 2004).
A 为整个 LGN 切片的低倍图(红=向 MT 投射的细胞,黑=向 V1 投射的细胞),B 为 A 中方框区的高倍图(蓝=MT 投射,棕=V1 投射)。读图要点:两个醒目的 MT 投射神经元没有双重标记,说明其轴突绕过 V1 直达 MT;且 MT 投射细胞优先位于 LGN 粒状细胞层——普遍认为该层携带强 S 信号。这是"S 信号以短至四级突触进入 MT"这条解剖证据的核心图像,对应结果第 2 条,同时作者也点明缺口:这些投射细胞的生理特性尚未被描述。
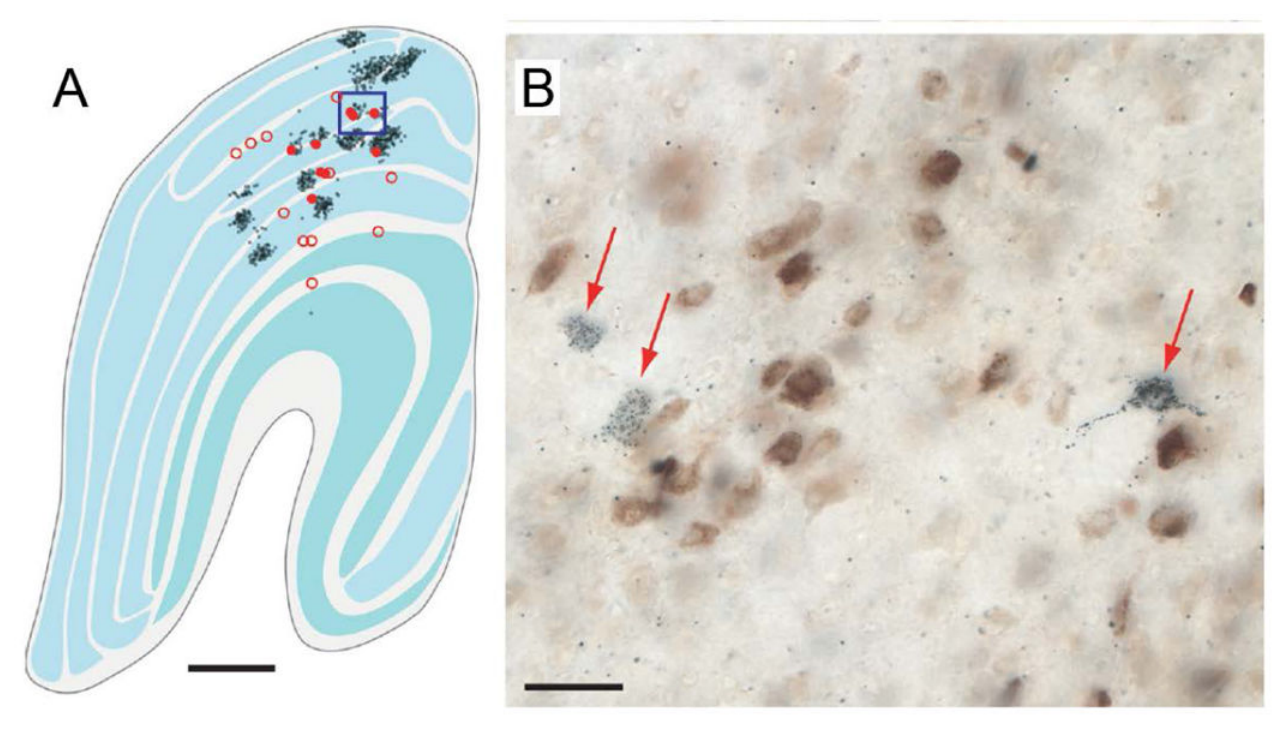
图 5 · V1 锥拮抗细胞群体对日光轴的偏置
原文图注:Figure 5. Cone-opponent cells in V1 are biased in chromatic tuning for colors of the daylight axis. A, responses of a population of cone-opponent neurons to cone-isolating stimuli, projected on the cone-opponent axes. Inset top right shows the standard C.I.E. chromaticity diagram with the cone-opponent axes intersecting at the neutral point, and the chromaticities of many samples of daylight. Inset top right shows the equiluminant plane through the DKL color space. Note that the 45° axis extending from –S/L-M through the origin towards +S/M-L forms the "daylight" axis. B, Macaque V1 responses measured using fMRI to different color directions of the DKL color space. Note the bias for the daylight axis. Responses have been normalized to 1. Stimuli comprised heterochromatic gratings, 2.9 cycles/degree, drifting slowly at 0.75 cycles/second, reversing direction every 2 seconds. Data from experiment 1 in (Lafer-Sousa et al., 2012).
A 部分把一群 V1 锥拮抗细胞对锥分离刺激的反应投影到锥拮抗轴上,右上插页的 C.I.E. 色度图标出众多日光样本的色度点——它们大致连成从 -S/L-M 穿过原点到 +S/M-L 的 45°"日光轴"。B 部分为清醒猕猴 V1 对 DKL 空间各颜色方向的 fMRI 响应(响应归一化为 1),沿日光轴的响应明显高于正交中间轴。这张图确立了"V1 存在非主轴颜色机制"这一事实:两条中间轴对主轴机制的激活相同,响应却不等——差异只能来自非线性组合,对应结果第 3 条。
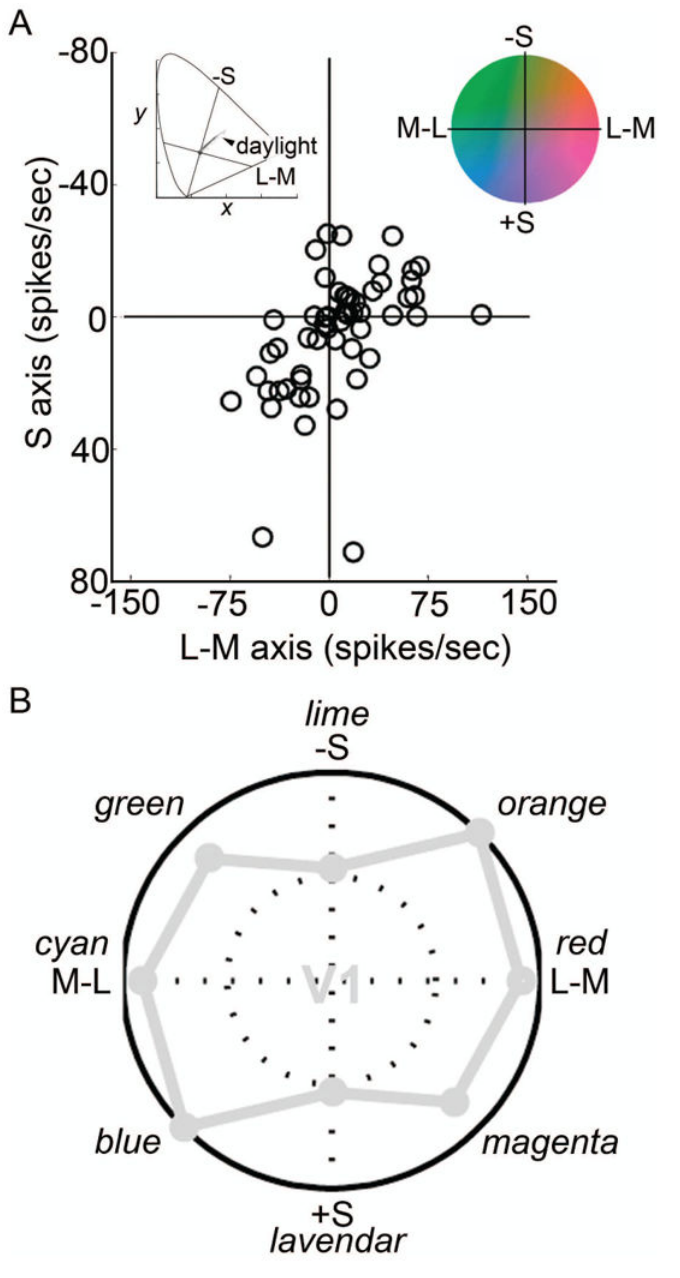
图 6 · 从 LGN 到 PIT 各阶段的色轴响应对比
原文图注:Figure 6. Responses measured using fMRI to different color directions of the DKL color space at multiple stages of visual processing. A, Responses within the LGN. B, Responses in MT. C, Responses in the portions of posterior IT that do not show a color bias ("i" for "in between" color-biased regions). D, Responses within color-biased regions of PIT. Responses in V1 shown in gray for comparison. Other conventions as for Figure 5B. PITi shows a pronounced bias along the daylight axis. Data from experiment 1 in (Lafer-Sousa et al., 2012). Cone contrasts for the four chromatic conditions given in Table 1 (adapted from Table 2 of Lafer-Sousa et al., 2012). Note that the two intermediate axes would elicit the same average activation of the underlying cardinal mechanisms, and that the total cone contrast (sum of L, M and S-cone contrasts) was much higher for the S stimulus than for the L-M stimulus. Despite the higher cone contrast, the response to the S stimulus was relatively low in LGN, V1, MT and PITi compared to the response to the L-M stimulus. PITc showed a relatively stronger response to S cones compared to V1. The increase in response along the S-axis within PIT color-biased regions achieves a more balanced response to all colors around the color wheel, and is consistent with the more likely involvement of this region in encoding color perception.
四个面板分别给出 LGN、MT、PIT 间隔区(PITi,"i"意为夹在偏色区之间)、PIT 偏色区(globs)对 DKL 空间各颜色方向的响应,V1 响应以灰色为参照。读这张图要盯住两点:其一,S 刺激的总视锥对比(0.803)远高于 L-M 刺激(0.194),但在 LGN、V1、MT、PITi 中 S 响应反而相对低——排除了"S 响应大是因为锥对比大"的平凡解释;其二,唯有 PITc 对 S 轴响应相对增强,使色轮四周响应更均衡。这一"S 信号增益唯 PITc 独有"的格局是全文最核心的实证图,对应结果第 3、4 条。
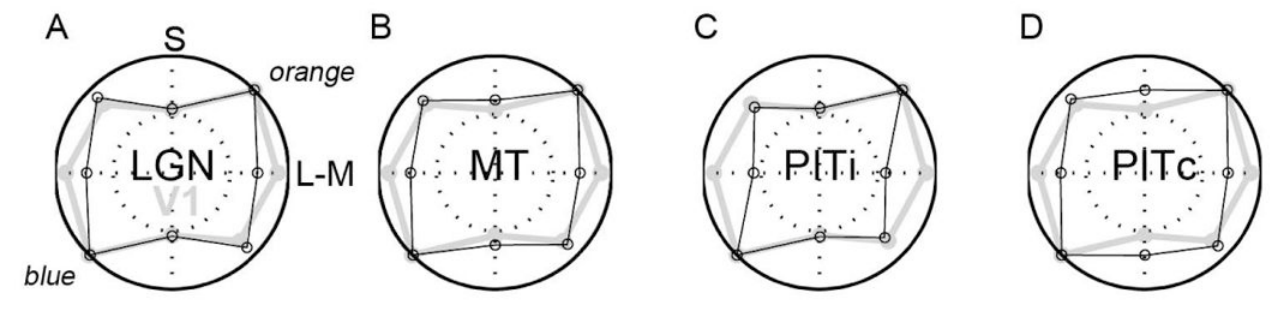
图 7 · 莫奈画中的蓝影子
原文图注:Figure 7. A, Morning Snow Effect (1891), oil on canvas (65.4×92.4cm), by Claude Monet. Museum of Fine Arts, Boston. B, Haystacks (Sunset)(1891), oil on canvas (73.3×92.7 cm), by Claude Monet. Museum of Fine Arts, Boston. Monet routinely depicts shadows with blue, surrounded by daylight yellow-orange.
两幅莫奈油画:《早雪》(1891)与《干草堆:日落》(1891),莫奈惯用蓝色画阴影、以日光黄-橙包围。这张图不是数据图,而是"光照假说"的直观注脚:天然场景中阴影由环境天光(偏蓝)照亮、日照区由直射阳光(偏黄)照亮,蓝-黄色轴边界因此携带三维几何信息;艺术家早已发现这样的描绘足以暗示场景结构。对应结果第 6 条与讨论中的生态功能论证。
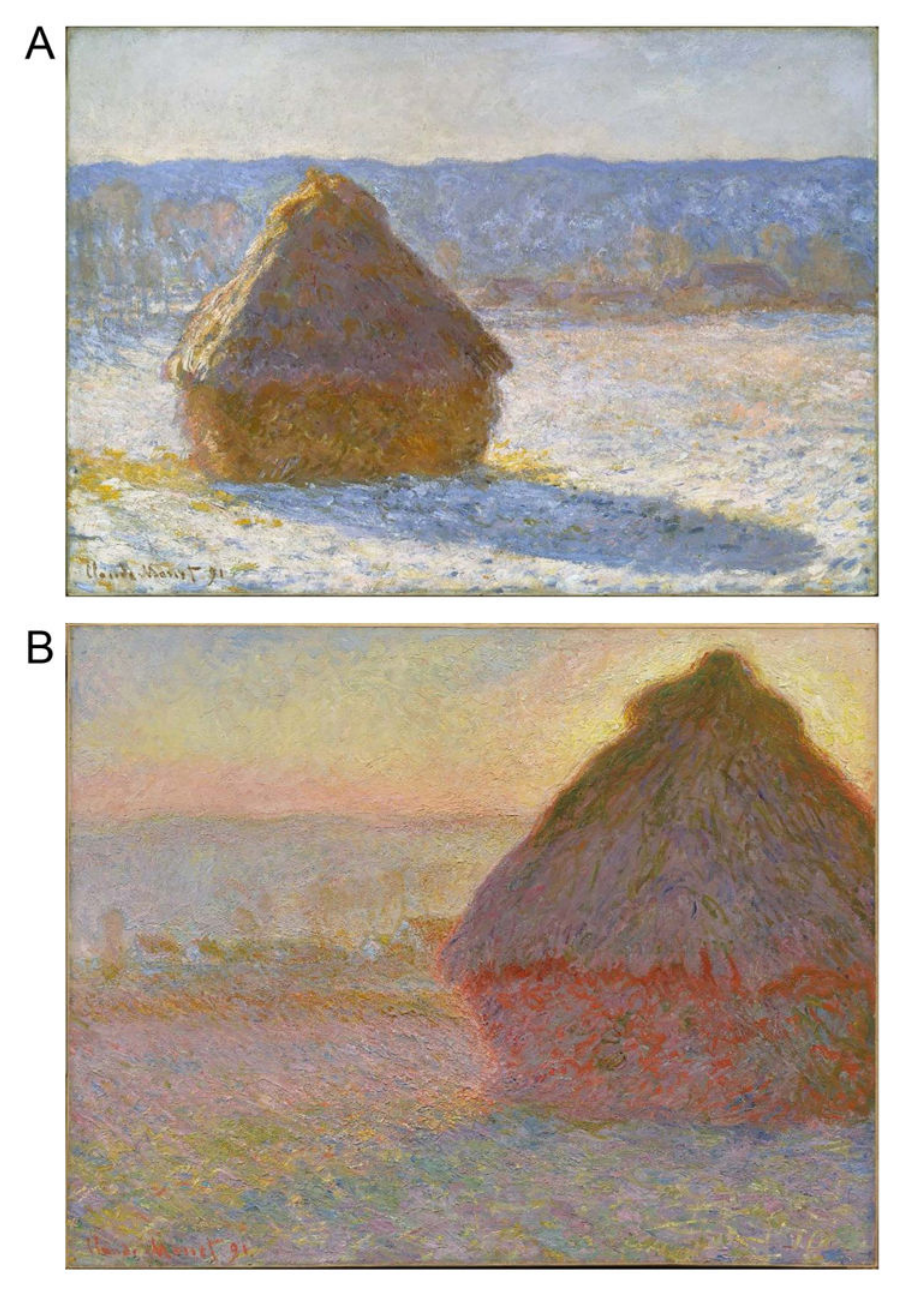
图 8 · PIT 绿色调 glob 细胞的朝向与颜色调谐
原文图注:Figure 8. Cone inputs to a green-tuned glob cell in PIT. A, Orientation tuning (max. 2 spikes/sec.) B, Color tuning (thick, medium and thin lines show tuning to higher, equal-with-background and lower luminance stimuli). C, L, M and S cone inputs. Compare with V1 cell (Fig. 2). Unpublished data of the author; see (Conway et al., 2007).
一个绿色调谐的 PIT glob 细胞的三项测量:A 为朝向调谐(最大约 2 spikes/s),B 为颜色调谐(粗、中、细线分别对应高于、等于、低于背景亮度的刺激——调谐形状基本不随亮度改变),C 为 L、M、S 视锥输入(与图 2 的 V1 细胞对照)。读图要点:C 部分显示该细胞对产生绿色的 M+、L-、S- 三种锥组合都有输入贡献,与 V1 细胞"S 与 M 空间符号对齐"的模式形成鲜明对比;B 部分的亮度耐受表明其调谐针对色调本身。这支撑结果第 4 条——V1 与 PIT 之间发生了从锥拮抗坐标到色调坐标的变换。
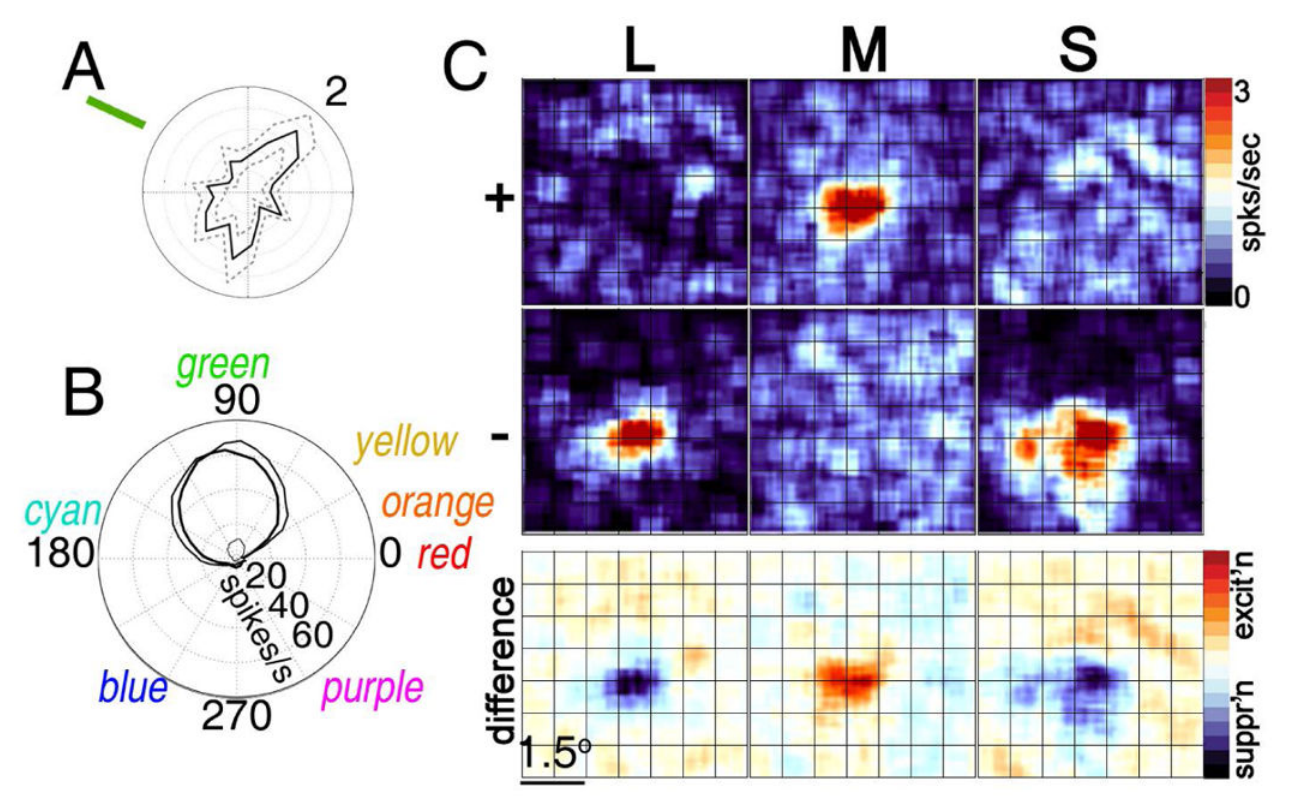
图 9 · PIT 颜色调谐细胞的"色位图"聚集
原文图注:Figure 9. Color-tuned neurons in PIT globs are clustered by color selectivity, and arranged according to "chromatopic" hue maps. A, Anatomical MRI of electrode targeting a color-biased region (glob). Scale, 1cm. B, Color tuning of six sequentially encountered neurons. Polar coordinates as for Figure 8B. C, Color tuning of all neurons encountered along the electrode path. Gray symbols show "outliers". D, Latency of the responses of the neurons. Data from (Conway & Tsao, 2009).
A 为电极对准偏色区的解剖 MRI(比例尺 1 cm);B 为沿穿刺轨迹连续遇到的六个细胞的颜色调谐(极坐标同图 8B);C 为整条轨迹上所有细胞的调谐汇总,灰色符号为"离群者";D 为各细胞的反应潜伏期。读图要点:相邻细胞调谐相近、按色轮次序系统漂移(红-橙-紫的次序),而离群细胞恰好潜伏期更长——作者猜测其感受野的外周被刺激激活。这张图是"色位图"组织的直接证据,对应结果第 5 条。
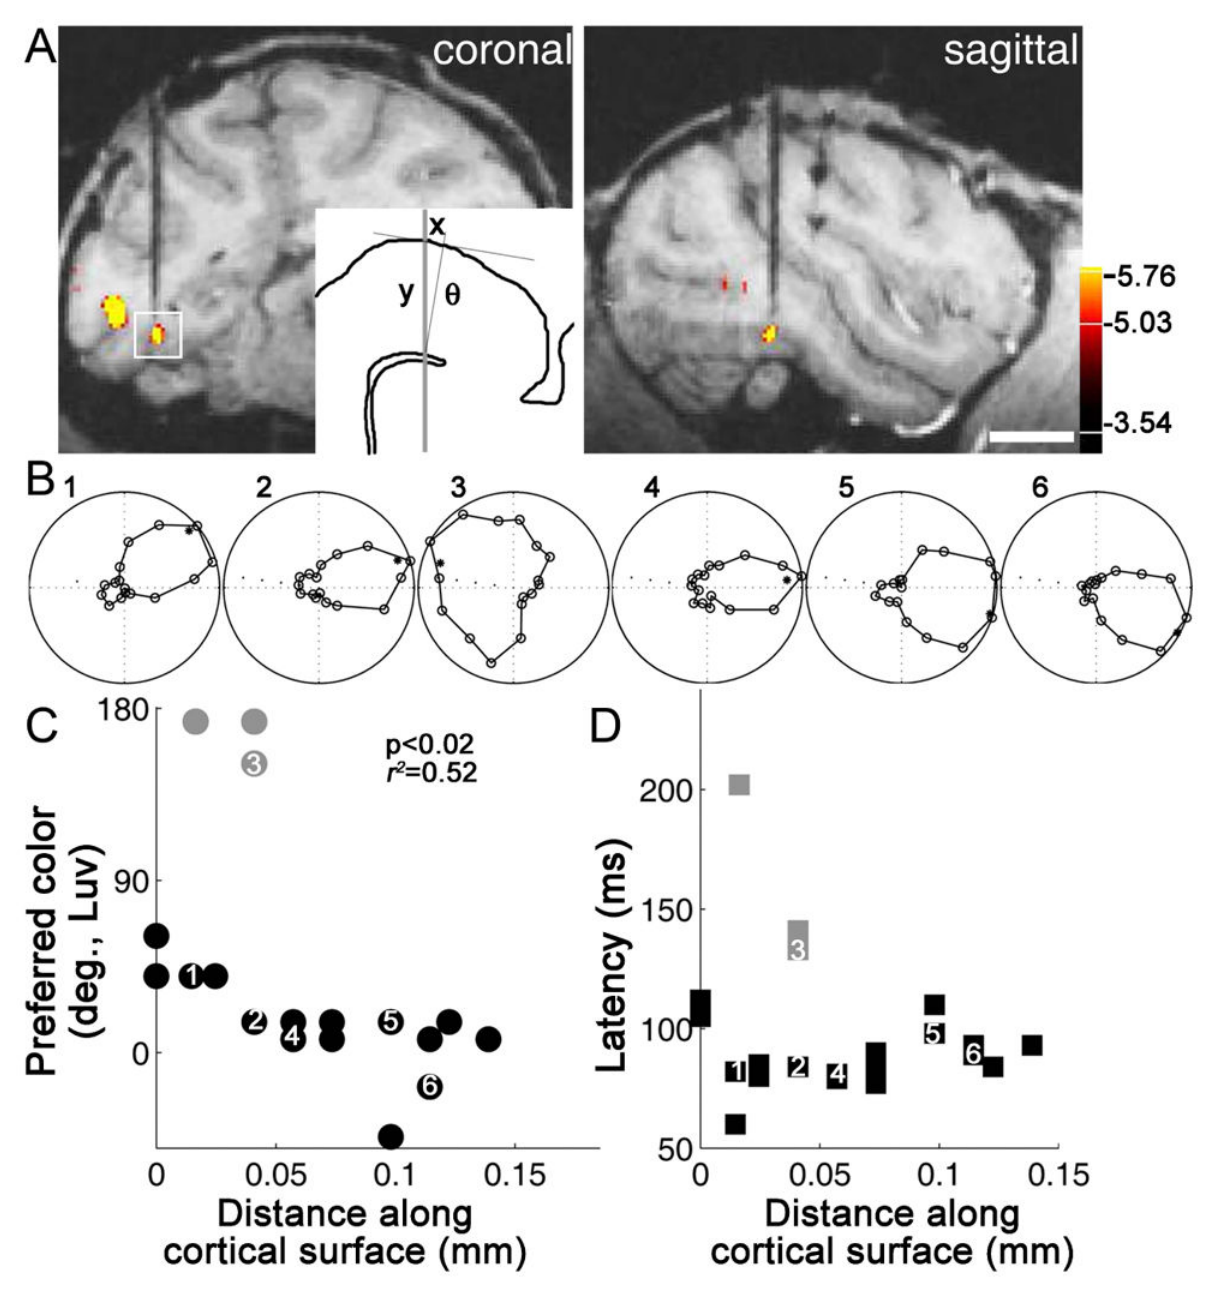
图 10 · PIT 蓝色调细胞的饱和度调谐与潜伏期编码
原文图注:Figure 10. Responses of a blue-tuned cell in PIT assessed using stimuli defined by the cone-opponent axes with which the retina/LGN represent color. A, Cone-opponent "DKL" color space, showing colors in the equiluminant plane at the adaptation point. B, Color stimuli of various saturations and luminance contrasts defined by the cone-opponent color space and projected in the standard C.I.E. xyY chromaticity space. C, Response of one color-tuned neuron to stimuli of varying saturation. Latencies (symbols) are systematically longer with lower saturation stimuli (responses at each saturation averaged across colors; colors defined within the equiluminant plane defined by the adapting background). Inset shows color tuning measured at three saturation levels. Figure prepared by Monica Gates and Galina Gagin (Unpublished data of the author).
A、B 两部分分别给出 DKL 等亮度平面与投影到 C.I.E. xyY 色度空间的不同饱和度/亮度对比刺激集合,C 部分为一个颜色调谐细胞对各饱和度刺激的反应。读图要点:主图显示饱和度越低潜伏期越长(各饱和度上的反应跨颜色平均),插页显示在三个饱和度水平上测得的调谐形状基本不变。这说明 PIT 细胞的颜色调谐对饱和度变化耐受(色调不变性),而饱和度本身可能由反应时序编码——这是"区间编码"假说的时间维度证据,对应结果第 4 条,作者也注明这属初步数据、需要更大群体研究验证。
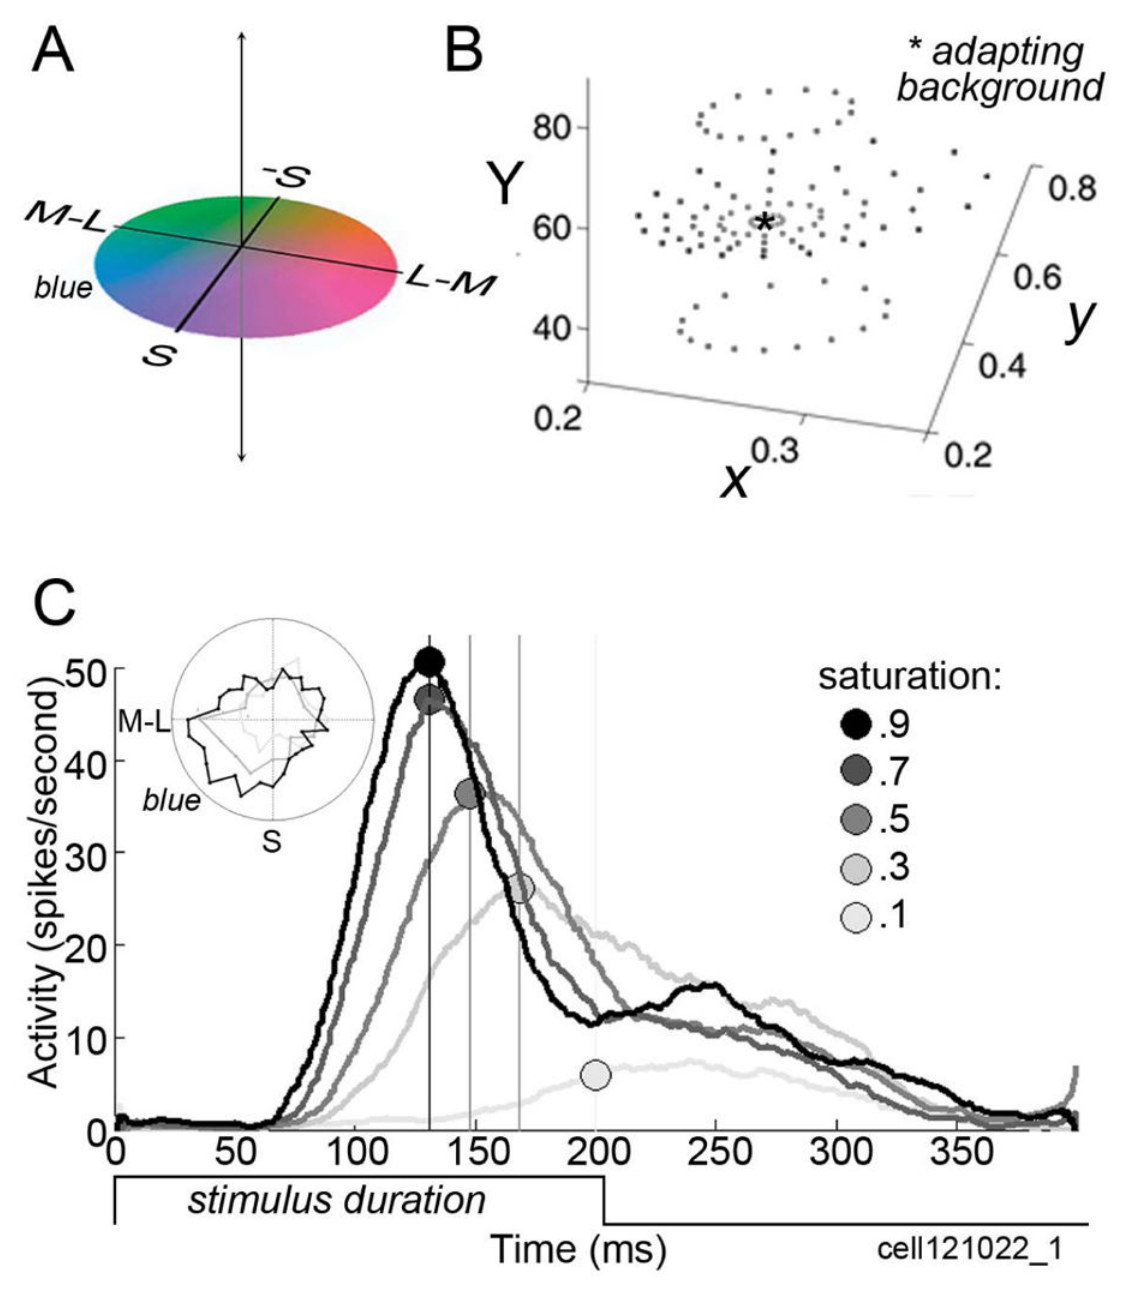
图 11 · Munsell 知觉颜色空间系统
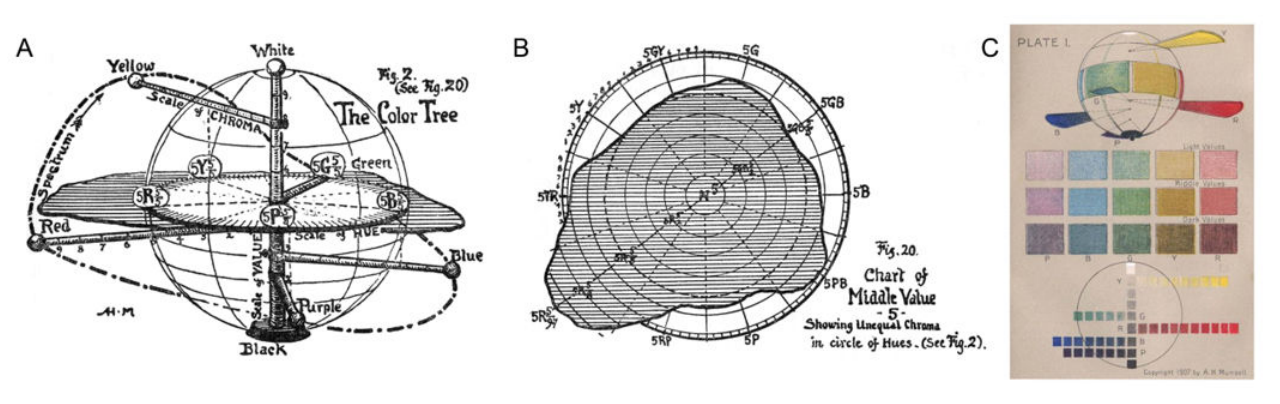
原文图注:Figure 11. Munsell color system of perceptual color space. A, From Munsell (1907): "The color tree is made by taking the vertical axis of the [color] sphere, which carries a scale of value [brightness or luminance], for the trunk. The branches are at right angles to the trunk; and, as in the sphere, they carry the scale of chroma [saturation]. Colored balls on the branches tell their Hue. In order to show the MAXIMA of color, each branch is attached to the trunk (or neutral axis) at a level demanded by its value,—the yellow nearest white at the top, then the green, red, blue, and purple branches, approaching black in the order of their lower values. The color tree prolongs [the chroma axes to represent] the most powerful red, yellow, green, blue, and purple pigments which we now possess, and could be lengthened, should stronger chromas be discovered." B, A horizontal plane through the Munsell system showing the non-spherical nature of the color plane. C, A color plate from Munsell's original book, showing The color sphere (top), fifteen typical steps taken from the sphere (middle), and the value and chroma scale (bottom). As Munsell noted, "Pigment inequalities here become very apparent."
A 引用 Munsell 1907 年的原文描述"颜色树":主干是明度轴、枝条是饱和度(彩度)轴、枝上的球是色调;关键细节是黄枝最靠近白色端、蓝枝更靠近黑端——黄色必然比蓝"更亮"。B 显示穿过 Munsell 系统的水平截面呈非球形,C 是 Munsell 原著中的色球图版。这张图支撑讨论部分的两个论证:任何 DKL 等亮度平面都无法同时容纳像样的蓝和像样的黄(因为黄比蓝亮),而 S 视锥是生成蓝(和黄)所必需的——所以 S 系统参与的不是亮度对比而是"光照"计算;同时,Munsell 空间这一经验确定的知觉几何该由哪个脑区实现,因 PIT 偏色区的发现而变得可以研究。
讨论
作者把全部证据收拢为两套编码方案:皮层下阶段(视网膜、LGN)以群体编码表征颜色——调谐峰对齐 L-M 与 S-(L+M) 两条主轴,一种颜色由两群神经元活动的加权平均描述;皮层(尤其纹外)阶段以区间编码表征——一群尖锐调谐、覆盖全部颜色空间的神经元加上赢者通吃规则,PIT glob 细胞调谐的尖锐化与非线性化正是这一变换的迹象。由此,S 信号的双重角色有了清晰分工:在颜色计算区,S 激活是把表征扩展到蓝(黄)端、实现知觉色空间均衡表示所必需的;在非颜色区(MT、PIT 间隔区),S 信号提供与亮度对比脱钩的光照线索,服务阴影检测、全局场景分析与运动知觉——这也顺带解释了黄色贴纸在白纸上显亮于纸面(尽管亮度更低)的知觉悖论。作者坦承多处局限:人类 fMRI 未发现 V1 日光轴偏置而猕猴有(物种差异未解决);MT 投射神经元的生理特性、自然视锥分离刺激下 glob 细胞反应弱的原因("若偏好不与分离刺激颜色对齐则反应不显著")均属未定;"独特色调"(unique hues)的神经基础仍是悬案,Stoughton 与 Conway(2008)报告的群体偏色部分源于刺激集把饱和度与色调混淆(显示器色域限制);对 V4/PIT 是否因果地参与色调知觉,结论性的检验需要密集采样颜色空间的刺激。作者还声明 V4/PIT 并非专属颜色区(与 Tootell、Komatsu、光学成像的多方证据一致),其内部由 glob 与间隔区拼成斑块状组织;讨论与 Munsell 空间、Hering 对立色的对话贯穿始终。
一句话总结
这篇综述最打动我的地方是把一个方法学陷阱挑明在标题上:脑里的"颜色信号"远多于颜色知觉,S 视锥响应既可能是色调计算的原料、也可能只是自然日光统计(阴影的蓝)留在系统里的指纹。在我看来"光照线索"假说还只是待检验的漂亮猜想,但它示范了一种值得学的推理方式——当你以为某个信号在做知觉计算时,先问一句它还能更便宜地用来干什么。
审校与证据追溯 (Verification & Evidence)
图表审计结果
- Fig1: 提取质量
good,对齐度full,识别面板[] - Fig10: 提取质量
good,对齐度full,识别面板[A, B, C, E] - Fig11: 提取质量
good,对齐度full,识别面板[A] - Fig2: 提取质量
good,对齐度full,识别面板[A] - Fig3: 提取质量
good,对齐度full,识别面板[A, B] - Fig4: 提取质量
good,对齐度full,识别面板[A, B] - Fig5: 提取质量
good,对齐度full,识别面板[A, B, C, E] - Fig6: 提取质量
good,对齐度full,识别面板[A, B, C, D] - Fig7: 提取质量
good,对齐度full,识别面板[A, B] - Fig8: 提取质量
good,对齐度full,识别面板[A, B, C] - Fig9: 提取质量
good,对齐度full,识别面板[A, B, C, D]
关键事实与局限性声明
- 补充要点: 遗漏了原文关于颜色调谐神经元在形状知觉(form perception)中的作用讨论,未在正文强调V1与V4/PIT颜色细胞的朝向调谐(orientation tuning)特性。