IT Literature Intelligence 终审版本 (VERIFIED) 论文编号:
027| 原始基线:V0_ZCODE_BASELINE| 语义审核:pass| 图表审核:passAstra裁决:compromise_revision(revise)
Color statistics of objects, and color tuning of object cortex in macaque monkey
Rosenthal · Journal of Vision · 2018 · Zotero itemID=288
一句话定位:这篇文章先对 20,840 张标注了物体边界的图像统计"物体像素"与"背景像素"的颜色属性,再用 fMRI 与 fMRI 引导的微电极记录检验猕猴 IT 的颜色调谐是否与这些统计对齐。它把"颜色为何存在"从哲学问题改写成可测量的假设——物体比背景更暖、更饱和,而这正是灵长类三色视觉演化的压力所在,也为 IT 的功能组织提供了行为学解释。
研究背景
颜色信号对高阶物体视觉有用的证据并不少:改为「颜色促进物体识别与记忆(Gegenfurtner & Rieger 2000)」。,加入颜色可提升识别模型性能,颜色索引是有效的机器视觉方法;自然场景的颜色统计本身偏向橙—蓝(Webster & Mollon 1997)。但颜色对物体检测与识别神经运算的贡献却长期被忽视,原因有三:物体识别文献把颜色当低级刺激特征,实验常用无彩色刺激,有影响的识别模型干脆忽略颜色;IT 组织原则被认为是语义类别、形状特征或物体大小而非颜色;以及给刺激加色对 IT 的 fMRI 响应提升幅度不大。更关键的一个缺口是:物体究竟能否只靠颜色信息被解码——此前的工作(Kriegeskorte et al. 2008)默认"动物/非动物"这类基本上位类别无法只用色度线索判定。已有的自然场景颜色统计研究测的是整幅场景的分布,而非人类观察者判定为"物体"的那部分像素,这正是本文要补上的测量。
研究思路
作者的逻辑链分三步。第一步建立行为学事实:用微软 MSRA 数据库(Liu et al. 2007)——从 20 万张网络图片中由人工挑出 20,840 张含显著物体的照片——请两名对实验目的不知情(naive)的观察者在边界框内进一步把像素划为物体或背景、标出物体名称(共得 2,781 个独特标签)并归入 animate/inanimate 两大类,然后比较物体与背景、动物与非动物、天然色与人工色物体三组像素的色调(hue)、彩度(chroma)与亮度对比统计。第二步问"这些差异可利用吗":训练只接收颜色特征的支撑向量机(SVM)分类器,与 HOG(方向梯度直方图)形状特征和 AlexNet 深度网络特征的表现对照。第三步把统计与神经对齐:用 12 种等亮度颜色测两只清醒猕猴的 fMRI 颜色调谐,逐体素计算调谐轮廓与物体颜色概率的相关,再用 fMRI 定位的颜色偏置区引导微电极记录加以确认。之所以选 L-M、S 这类锥拮抗机制的方向做特征,是因为它们直接对应视网膜之后的颜色编码机制,能把行为统计与生理调谐放在同一坐标系。
方法
图像分析:像素色用 CIELUV 的 u′v′ 色度坐标表示(图 2、3 用 D65 白点,其余图用 D50,结论不受白点选择影响),彩度为 CIE 1976 chroma,亮度对比为 Michelson 对比;像素经 CIECAM02 矩阵转成 LMS 视锥兴奋。物体颜色概率定义为"某颜色出现在物体像素中的次数除以该颜色出现在物体+背景像素中的次数"。fMRI:3T Siemens 扫描仪加 AC88 梯度线圈、MION 造影剂,两只清醒固定注视的雄性猕猴(7–8 kg),1 mm³ 体素;刺激为锥拮抗空间等亮度面上定义的 12 种颜色(各色与灰交替的漂移光栅,等 CIELUV 彩度、平均亮度 55 cd/m²),32 s 区组与灰色适应区组交替,分析体素百分比信号变化(psc)。电生理:两组数据——本实验在 fMRI 定位的后部颜色偏置区(PIT 内、V4 复合体前方)记录 16 色反应(猴 M1 共 117 个细胞、54 次穿刺),另一组是此前发表的 V4 复合体内 globs(fMRI 鉴定的颜色偏置小团)与 interglob 细胞(N=300 与 181);刺激为手绘感受野内闪烁的彩色条/块 200 ms、灰屏间隔 200 ms,每色至少 3 次呈现,群体响应取全部细胞对每色平均放电率(不同于以往按峰值调谐作直方图的做法,更接近 fMRI 信号的细胞学对应物)。
主要结果
-
物体比背景更暖、更饱和。背景像素偏冷(偏蓝、偏绿、偏灰),物体像素偏暖(偏黄、偏红),天然色与人工色物体皆然;区分主要体现在 CIE u′ 方向(反映 L-M 视后机制而非 S 机制)——天然物体 vs 背景 u′ 上 p=0(100 次重复全部显著),v′ 上 p<10⁻⁶⁷(图 1)。
-
颜色越暖越可能是物体。物体颜色概率与 u′(暖色程度)的 Pearson 相关:天然物体 r=0.93、人工物体 r=0.88(全像素);对像素间相关性问题做了"每图只取一对像素"的子抽样检验,结果不变(天然 r=0.79、人工 r=0.51,两者差异 Fisher z′=5.8, p=10⁻⁹),且人工物体的平均 u′ 高于天然物体(图 2)。彩度上物体高于背景(最高彩度 bin p=10⁻¹²),人工色物体向彩度两端偏置(最高端 p=10⁻¹²、最低端 p=0.02),亮度对比呈人工色"夸张化"趋势(各星号对 chi-square p<0.03)(图 3)。
-
只用颜色即可把物体从背景中分类出来。SVM 用色调一项的物体判定准确率 64.5%,彩度 60.2%,亮度 48.2%,三项合并 65.1%;ROC 曲线下面积(AUC)分别为合并 0.77、色调 0.72、彩度 0.63、亮度 0.63(均 p<0.0001)。用视锥机制做特征时,L、M、S 单独都在机会水平(约 49–51%),L-M 达 68.1%(AUC 0.72),S−(L+M) 仅 50.9%(AUC 0.61)——只有 L-M 与 S 曲线与其余所有曲线及彼此显著不同(p<0.0001)(图 4)。这把"物体 vs 背景"的色度学签名锁定在红绿机制上。
-
颜色携带"动物性"信息。animate 与 inanimate 物体像素的色度统计不同,且区分主要体现在 CIE v′(蓝—黄)方向(v′ 上 100/100 次迭代 p<10⁻⁸⁰;u′ 上 77/100 次 p<0.05)(图 5)。对 Kriegeskorte 等(2008)的 92 张图片("animacy 是 IT 组织原则"结论所用的同一刺激集),只喂给分类器每个物体的平均 u′v′:线性分类器最多 76.1%(用平均彩度),而径向基函数 SVM 达 81.5%;训练在平均 CIE u′v′ 上的 RBF-SVM 对 animate 图判对 91.67%、inanimate 判对 70.45%(图 6)。在 MSRA 全集上,仅色相的 SVM 判 animate 76.0%/inanimate 55.0%,与 HOG(54.4%/73.8%)和 DCNN(83.1%/28.6%)相比并无实质劣势(各 AUC:HOG 0.88、颜色 0.70、DCNN 0.56;表 1)——此前"animacy 不可能由颜色判定"的主流看法被推翻。
-
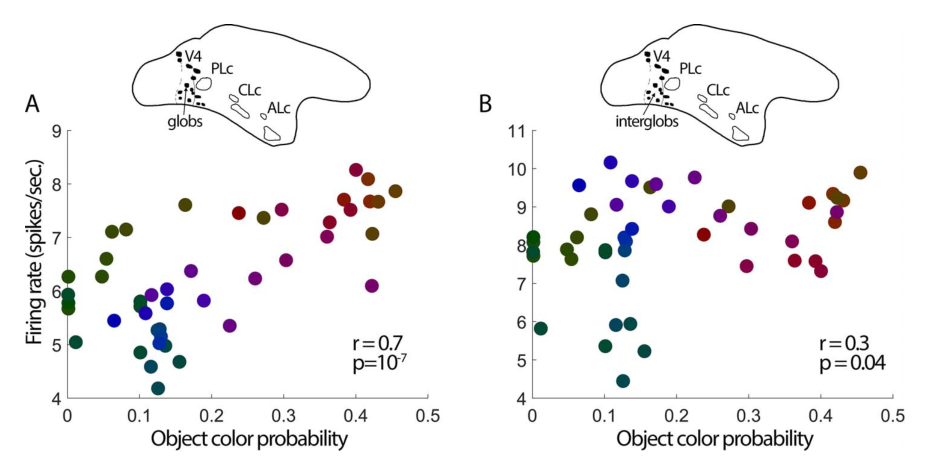
IT 的颜色调谐与物体颜色统计对齐,且强于 V1。三个 IT 颜色偏置区(后/中/前外侧色区 PLc、CLc、ALc)对"更可能作为物体颜色出现"的色反应更强(PLc r=0.7, p=0.01;CLc r=0.72, p=0.01;ALc r=0.65, p=0.03)(图 7)。全皮层逐体素相关呈一条贯穿颜色偏置区与面孔斑块、覆盖 IT 大部的条带,IT 的平均相关显著高于 V1(配对 t 检验 p=0.03);fMRI 引导电生理的群体(117 细胞)同样偏向物体色(r=0.56, p=0.025)(图 8)。V4 复合体内,globs 细胞群体与物体颜色统计相关很强(r=0.7, p=10⁻⁷),interglob 细胞相关弱得多(r=0.3, p=0.04;Fisher z′=2.2, p=0.02)(图 9)——提示"物体—颜色绑定"的皮层表征源头在 V1 之前之后、约在 V4/IT 一带形成。
图注解读
图 1 · 物体像素与背景像素的色度统计对比
原文图注:Figure 1. The color statistics of objects. (A) From over 200,000 images, observers at Microsoft selected 20,840 images that contained a salient object and placed a red bounding box around the object (Liu et al., 2007). Two naïve observers in the present study then created masks to demarcate the pixels containing the object. The top panels show example images; the bottom panels show the masks. (B) Tapestry plots showing 10,000 pixels randomly selected from the pixels assigned to backgrounds (1.89 billon pixels total), naturally colored objects (0.26 billion pixels), and artificially colored objects (0.22 billion pixels). (C) Chromaticity coordinates of the pixel colors of the tapestry plots. The figure shows a single lightness plane through the chromaticity space, with pixels of all lightness projected onto that plane. …… Pixels from naturally colored objects were different from pixels in backgrounds along the u′ dimension (p = 0 for all 100 iterations, unpaired t test), and along the v′ direction (p < 10⁻⁶⁷ for all 100 iterations).
(A) 展示数据来源:微软标注的边界框加上本研究两名 naive 观察者的像素级掩膜;(B) 三类像素各随机抽 1 万个拼成"织锦图",直观可见背景像素群偏冷、物体像素群偏暖;(C) 把这些像素投影到 u′v′ 色度平面上(点色编码明度),内嵌放大图显示物体相对背景的系统性位移沿 u′ 轴。这为主结果 1 提供总体证据:物体的"暖色偏置"在天然色与人工色物体中都成立。
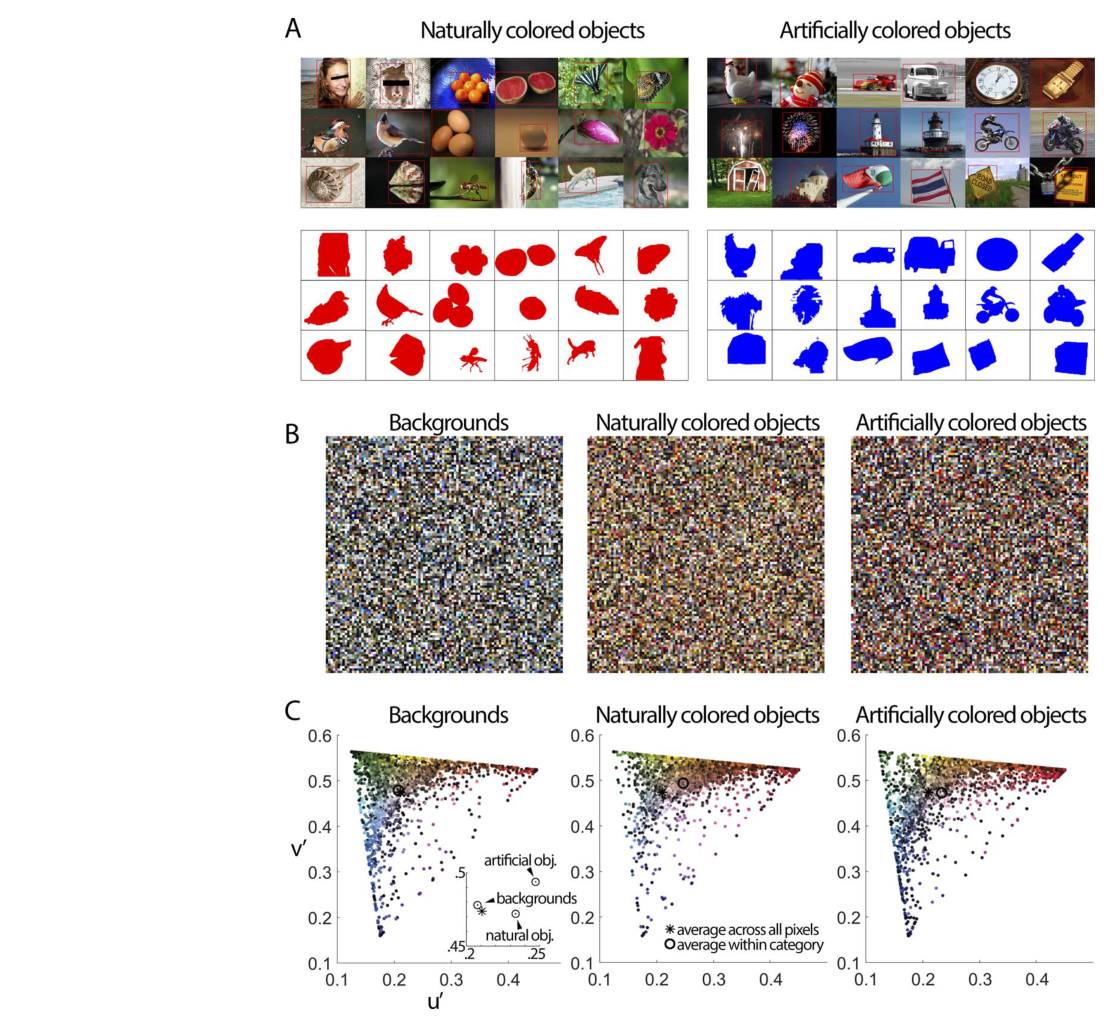
图 2 · 物体颜色概率随暖色程度单调上升
原文图注:Figure 2. Object-color probability, rank-ordered by most frequent object colors. (A) Pixels across the 20,840 images were categorized into 240 bins (24 evenly spaced hue angles at 10 chroma values in u′v′). Object-color probability was computed as follows: number of pixels having a given color in the objects divided by the number of pixels having the same color in the objects + backgrounds. The colors of the bars correspond to the sRGB colors of the bins. The bars are rank-ordered with the most frequently occurring object colors on the left.
(A) 每根柱是一个"色调×彩度"bin(240 个),柱高为该颜色成为物体(而非背景)的概率,柱色为其 sRGB 颜色,按概率从高到低排序,误差棒为 1,000 次 bootstrap 的标准差;(B) 是控制图像内像素相关性的"每图一对像素"版本;(C) 把物体颜色概率对 u′ 作相关(101 个 bin,箭头标白点位置),左为全像素、右为单像素对版本。读图要点:概率最高的柱集中在暖色(u′ 大)一侧,相关性天然物体(r=0.93)高于人工物体(r=0.88)。支撑主结果 2 与"暖色是物体的签名"这一核心论点。
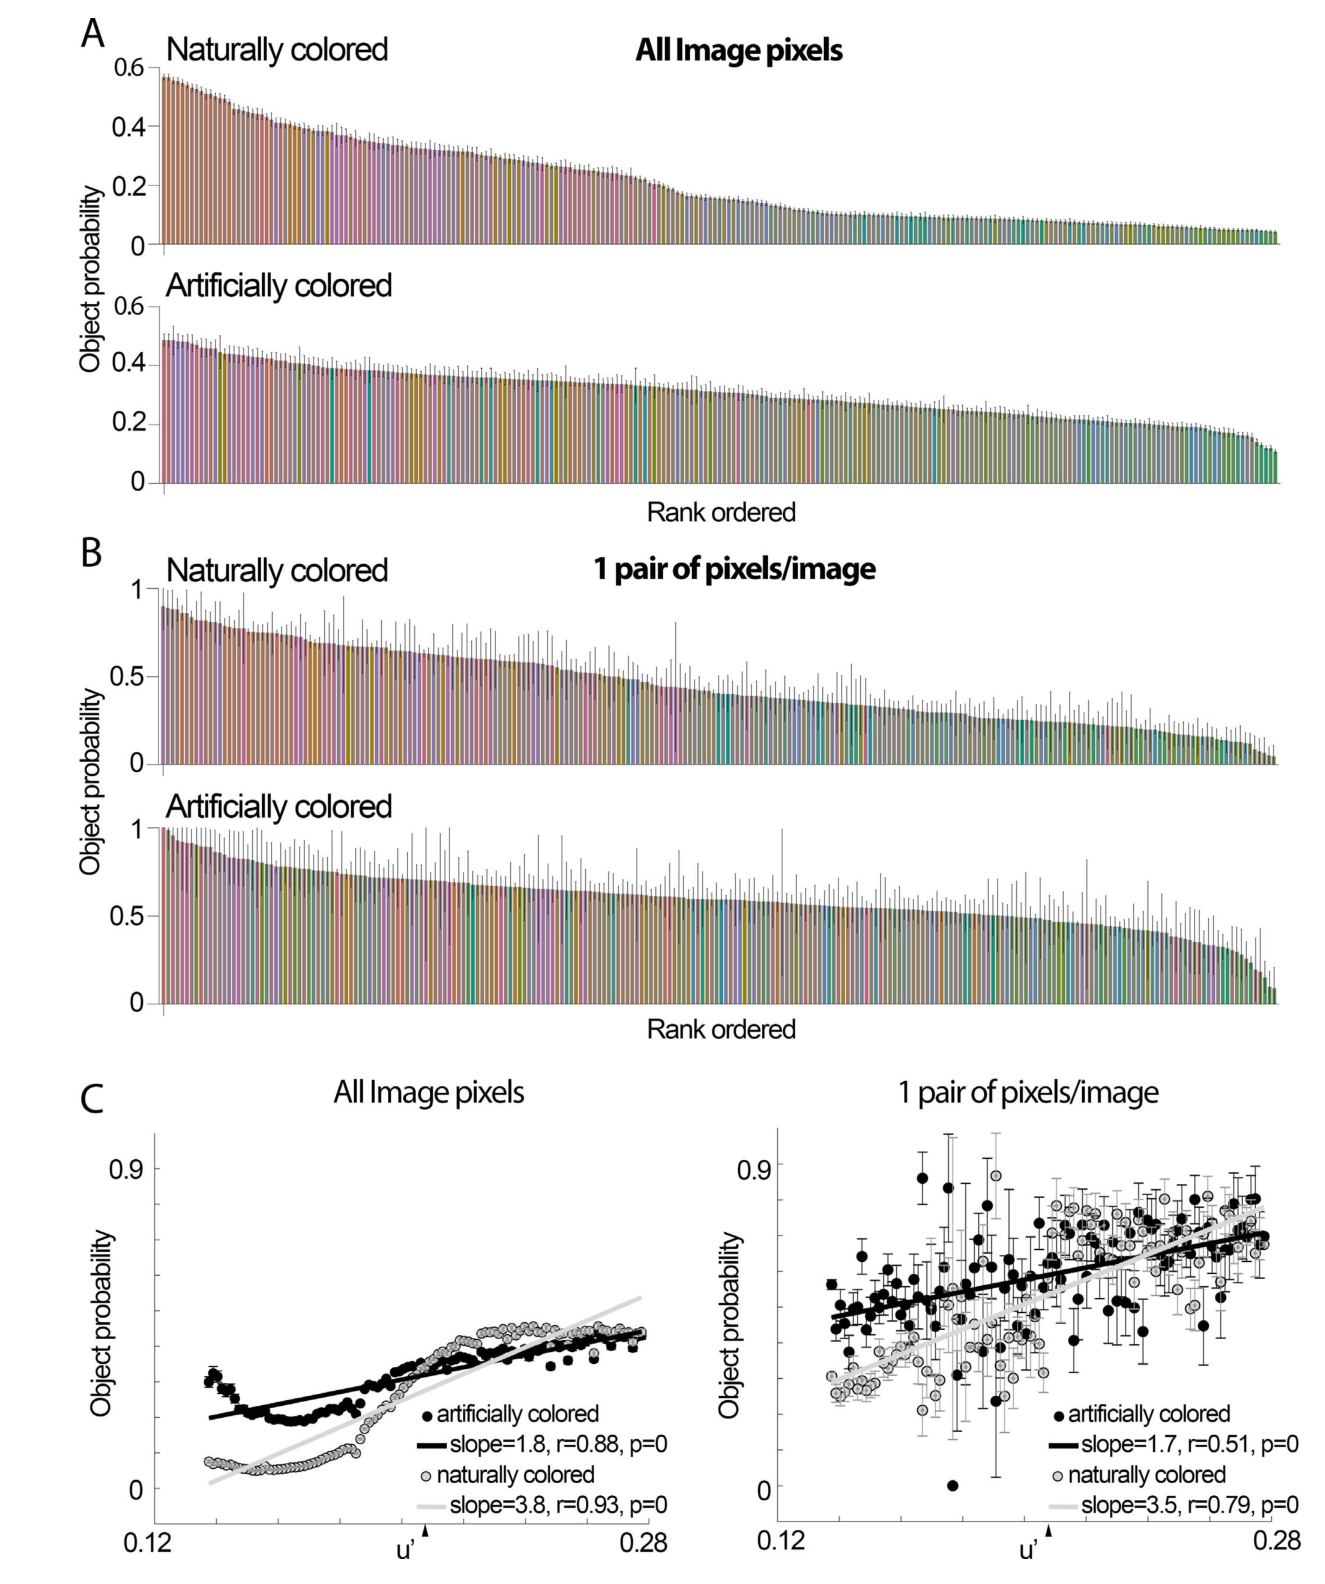
图 3 · 彩度与亮度对比:物体更饱和、人工色走极端
原文图注:Figure 3. Color chroma and luminance-contrast statistics of objects. (A) Histograms showing the chroma of the pixels identified as part of objects (black bars), and the chroma of the pixels identified as part of backgrounds (open bars). Chroma was defined as the CIE 1976 chroma. (B) The chroma of pixels identified as naturally colored (black bars) and artificially colored (open bars). Artificially colored objects were biased towards the chroma extremes, showing more low-chroma pixels and more high-chroma pixels compared to naturally colored objects. (C) The luminance contrast of all image pixels identified as part of naturally colored objects (black bars) are compared against the contrast of the pixels identified as part of artificially colored objects (white bars). …… All differences between pairs of bars identified by an asterisk were significant (chi-square test of proportions, p < 0.03).
三组直方图:(A) 物体(黑)对背景(空心)的彩度分布,绝大多数像素彩度都很低,但最高彩度端物体占比显著更高(p=10⁻¹²);(B) 天然色对人工色的彩度分布,人工色向两端"夸张"——低端与高端都更多;(C) 亮度对比分布,两类物体的峰值都在零点略左(物体平均比背景略暗),高对比端更偏"亮"而非"暗",人工色物体在两端都更多。星号标出显著的柱对(chi-square, p<0.03)。支撑主结果 2 的彩度/亮度部分与"人工着色复制并放大自然趋势"的讨论点。
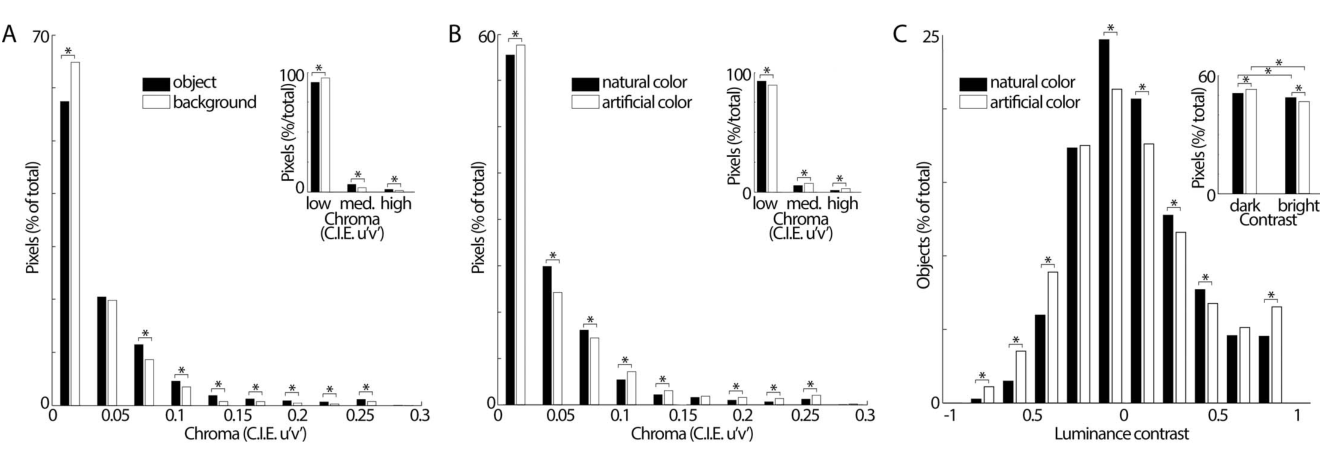
图 4 · 用颜色特征判物体/背景的 ROC 曲线
原文图注:Figure 4. Receiver operating characteristic (ROC) analysis showed that objects can be discriminated from backgrounds based on color. (A) ROC curves when using hue, chroma, and luminance, and all three as input to a support vector machine (SVM) classifier. All ROC curves were significantly different from the null curve (Wilcoxon rank sum test, p < 0.0001). (B) ROC curves when using L, M, S, L-M, S-(L-M), and the two intermediate directions in cone-opponent space as features for SVM for classification (Int1 = orange-blue axis; Int2 = green-purple axis). All ROC curves were different from the null curve (Wilcoxon rank sum test, p < 0.0001). Only the L-M curve and the S curve were different from all other curves, and each other (p < 0.0001).
(A) 横轴为假阳性率、纵轴为真阳性率的 ROC 曲线:合并三特征 AUC=0.77 最高,色调 0.72 次之,彩度与亮度各 0.63;(B) 换用视锥及视后机制方向的曲线:L-M(红绿轴)AUC=0.72 明显压过 S(蓝黄)的 0.61,两个中间轴(橙蓝、绿紫)与 L、M、S 一样停在机会附近。对角虚线为零曲线,全部曲线显著偏离零曲线(p<0.0001),但(B)中只有 L-M 与 S 同时显著区别于其余所有曲线。这张图把"物体的颜色签名主要编码在红绿机制"定量化,支撑主结果 1、3 及三色视觉演化论点的关键证据。
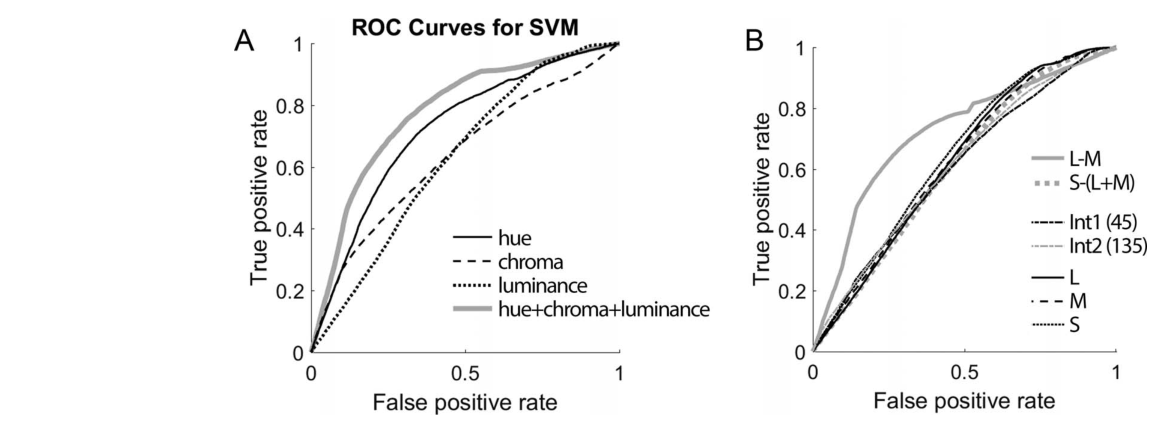
图 5 · 动物与非动物物体的色度统计差异
原文图注:Figure 5. Color statistics differed for animate and inanimate objects. Average chromaticity coordinates for pixels identified as part of animate or inanimate objects. Pixels were drawn from a tapestry of 10,000 randomly selected pixels from each category. This analysis was repeated 100 times. Pixels of animate objects were different from pixels of inanimate objects along the u′ dimension (p < 0.05 for 77/100 iterations), and along the v′ direction (p < 10⁻⁸⁰ for all 100 iterations). Error bars are SEM.
把 20,840 张图的物体标签归并为 animate/inanimate 两类后,各取 1 万个随机像素算平均色度坐标并画在 u′v′ 平面上(误差棒为 SEM,分析重复 100 次)。两类物体在 u′ 上有差异(77/100 次显著)但在 v′(蓝—黄轴)上差异压倒性稳定(100/100 次 p<10⁻⁸⁰)。与图 1、2 的"物体 vs 背景靠 u′"对照,这说明类别层面的颜色签名换到了另一条机制轴上,是主结果 4 的统计基础。
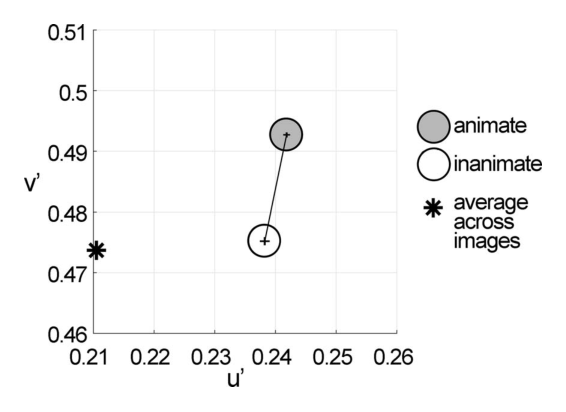
图 6 · 只凭物体平均颜色即可判 animate/inanimate
原文图注:Figure 6. Images could be categorized as animate versus inanimate using only the average color of the object in each image. (A) Chromaticity coordinates for the 92 images used by Kriegestkorte et al. (2008). The asterisks show the neutral point of the color space. The blue circles are the average u′v′ value of all the color values plotted in the figure. (B) A support vector machine with a radial basis function trained on only the average CIE u′v′ of the object in each image categorized animate images at an accuracy of 91.67% and inanimate images at an accuracy of 70.45%. Inset shows the chromaticity coordinates for all images as in A, in which open symbols indicate images classified as "animate" and filled symbols indicated images classified as "inanimate". Stimuli are reproduced with permission from Nico Kriegeskorte.
(A) Kriegeskorte 92 图(animate/inanimate 的经典刺激集)各图的平均 u′v′ 色度散点,星号为中性点;(B) 只用每图物体平均 u′v′ 训练的 RBF 核 SVM 的判别结果:animate 91.67%、inanimate 70.45%(机会水平 52%/48%),内嵌小图用空心/实心符号标出被判为 animate/inanimate 的图。此图直接反驳"animacy 无法由颜色判定"的旧结论,且用的是当年支撑"IT 以 animacy 组织"的同一批图像,回击力最强。支撑主结果 4。
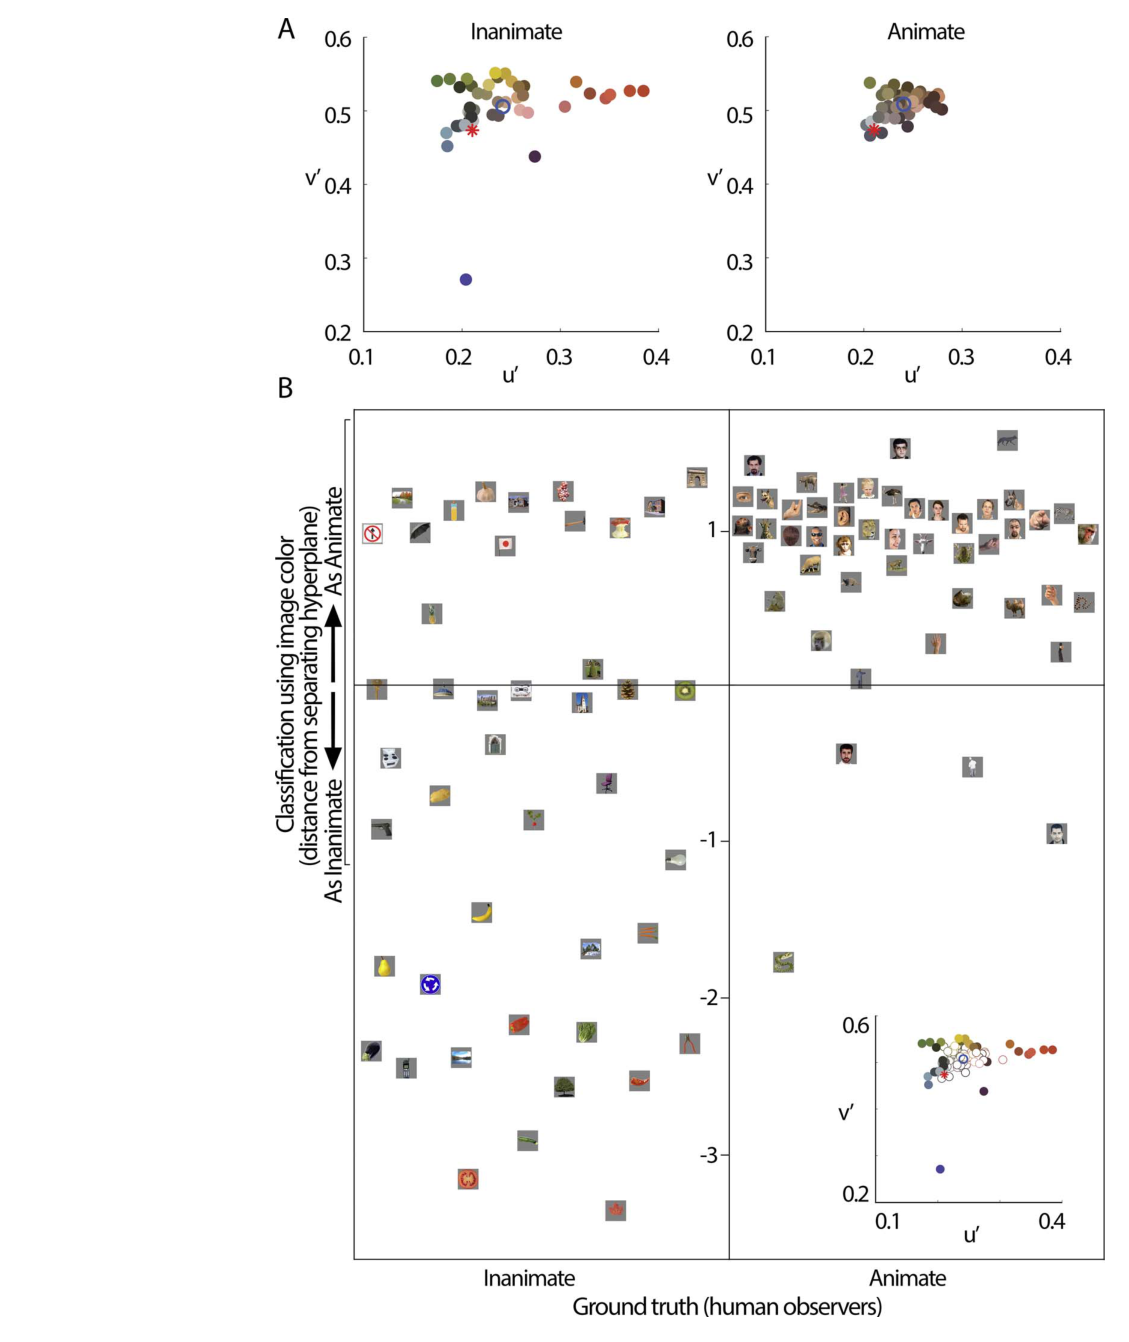
图 7 · IT 三个颜色偏置区的调谐与物体颜色概率正相关
原文图注:Figure 7. Correlation of object-color statistics and color-tuning of IT color-biased regions. A. Diagram of the lateral view of the macaque brain showing the location of the color-biased regions in inferior temporal cortex (IT), anterior is to the right (Posterior Lateral color, PLc; Central Lateral color, CLc; and Anterior lateral color, ALc; Lafer-Sousa & Conway, 2013). (B) Chromaticities of the colors used in these fMRI experiments. (C) Relationship of the probability of object colors versus color-tuning of color-biased regions within IT. Object-color probability was computed as follows: number of pixels having a given color in the objects divided by the number of pixels having the same color in the objects + background, in natural images. All three regions showed higher responses for colors that were more likely to be the colors of objects (PLc: r = 0.7, p = 0.01; CLc: r = 0.72, p = 0.01; ALc: r = 0.65, p = 0.03). fMRI response (psc) = percent signal change.
(A) 猕猴脑侧视图标出 IT 上三个颜色偏置区位置(前向右);(B) fMRI 实验所用 12 色在色度图上的位置(锥拮抗等亮度面、等 CIELUV 彩度);(C) 横轴为每色的物体颜色概率、纵轴为该区 fMRI 百分比信号变化:三个区的调谐曲线都随"物体颜色概率"上升而升高(PLc r=0.7、CLc r=0.72、ALc r=0.65,均显著)。这是把行为统计与神经调谐直接对齐的核心图,支撑主结果 5 前半。
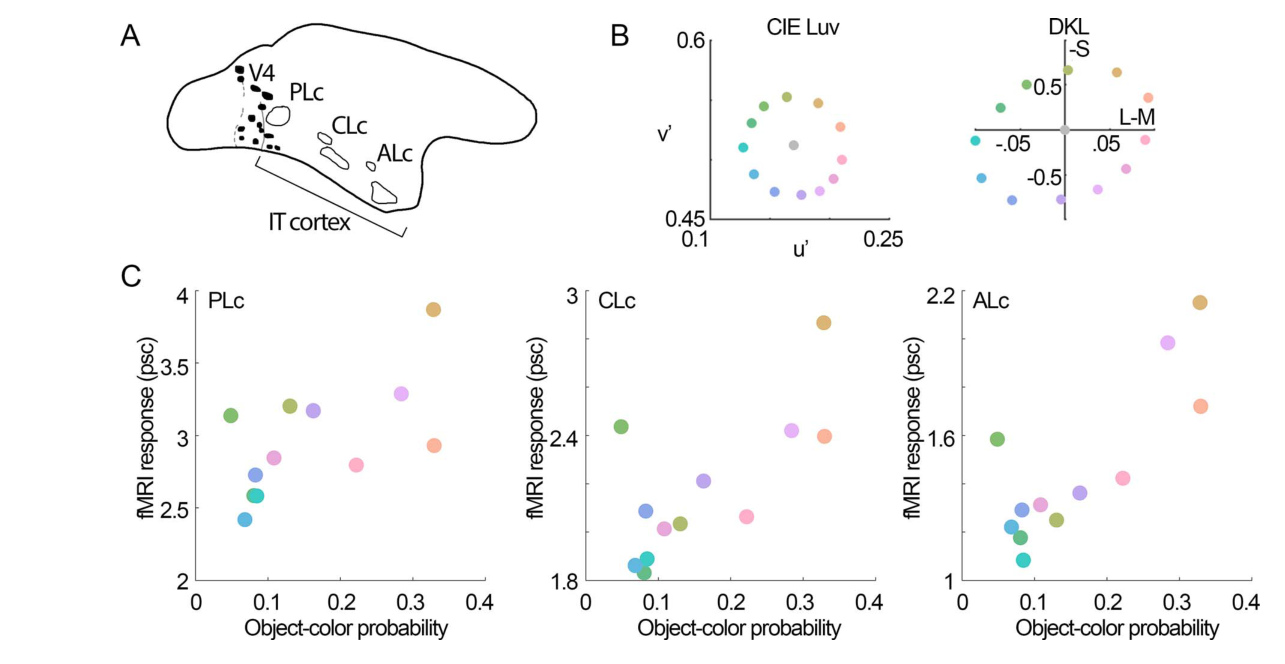
图 8 · 物体颜色概率—颜色调谐相关在全皮层的分布
原文图注:Figure 8. Correlation of object-color statistics across the cerebral cortex. (A) Correlation coefficients between fMRI color tuning and object-color probabilities assessed for each voxel across both hemispheres for one monkey (M1). Color-biased regions are outlined in white; face patches are outlined in black. Vertical meridians are shown as broken lines; horizontal meridians are shown as solid lines. (B) Correlation coefficients were higher in IT compared to V1; the IT region of interest was defined by combining the color-biased regions and the face patches (paired t test across V1 and IT, p = 0.03; LH = left hemisphere; RH = right hemisphere). (C) The population of neurons recorded in fMRI-guided recordings of the posterior color-biased region showed a bias for colors more often associated with objects, consistent with the fMRI results (r = 0.56, p = 0.025). Data were obtained from 117 cells in 54 penetrations in M1.
(A) 猴 M1 双半球逐体素的"fMRI 颜色调谐×物体颜色概率"相关图(白色轮廓为颜色偏置区、黑色为面孔斑块,虚/实线为经纬线边界):相关最强的区域连成一条贯穿 IT 的带。(B) ROI 层面的柱状比较:把颜色偏置区与面孔斑块合并定义 IT,其平均相关显著高于 V1(配对 t 检验 p=0.03)。(C) fMRI 引导电生理(117 细胞、54 次穿刺)的群体调谐同样偏向物体常见色(r=0.56, p=0.025),证明 fMRI 结果在单细胞层面成立。支撑主结果 5 中"IT 强于 V1"与电生理确认两部分。
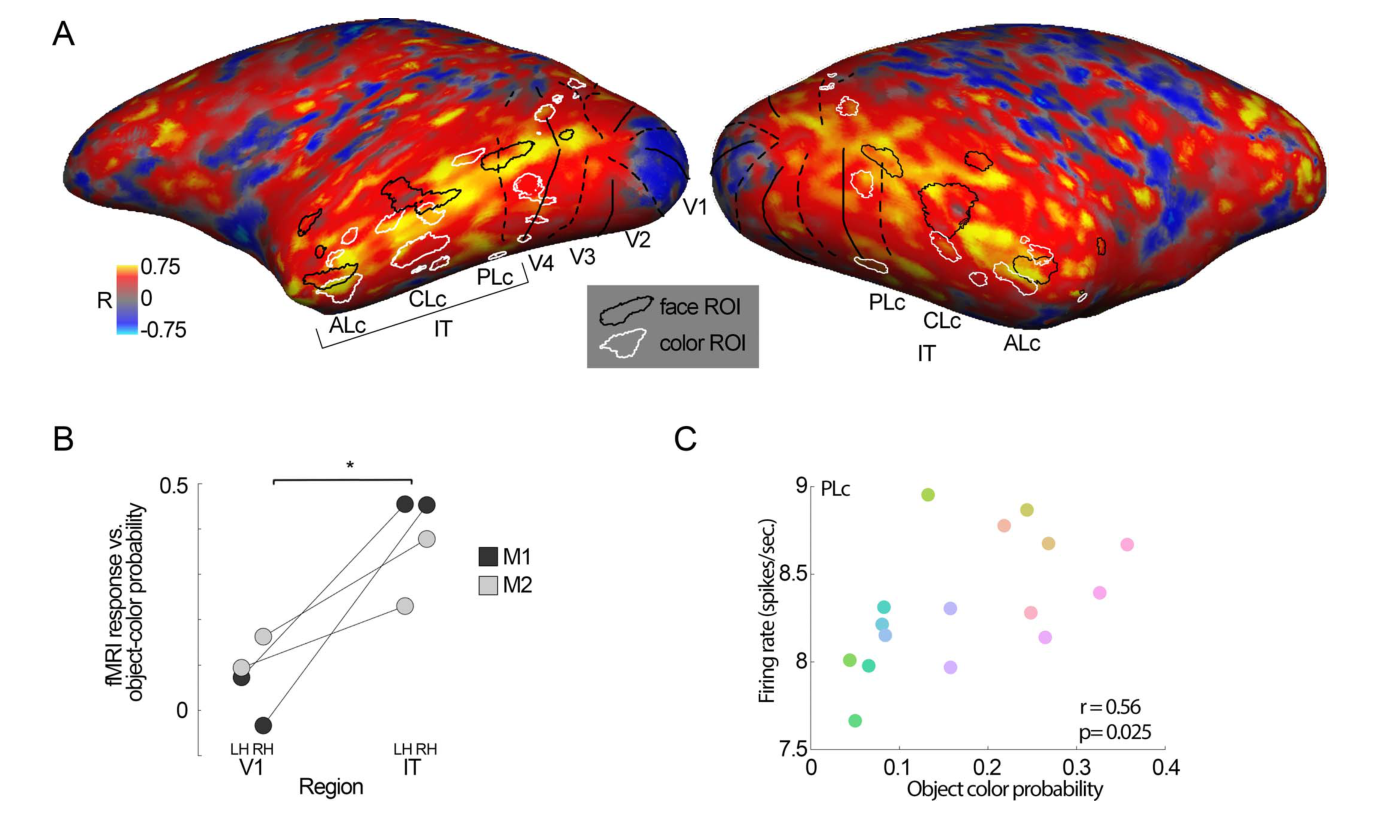
图 9 · globs 与 interglob 细胞群体的调谐—统计相关对比
原文图注:Figure 9. Color-tuning of the population of neurons recorded in posterior IT (the V4 Complex) was correlated with object-color statistics. (A) Responses of cells located within globs (fMRI-identified color-biased regions of the V4 Complex; N = 300 cells. The glob-cell population showed a stronger response to the colors more likely associated with naturally colored objects (r = 0.7, p = 10⁻⁷). (B) Responses of cells located within interglob regions (N = 181 cells). The interglob-cell population showed a stronger response to the colors more likely associated with objects, but a lower correlation coefficient than was found among glob cells (r = 0.3, p = 0.04, Fisher z′ = 2.2, p = 0.02).
(A) V4 复合体内 fMRI 鉴定的颜色偏置团(globs)300 个细胞的群体响应:对"更常见为物体颜色"的色反应显著更强(r=0.7, p=10⁻⁷);(B) globs 之间的区域(interglob)181 个细胞:有同样趋势但相关弱得多(r=0.3, p=0.04;两群体差异 Fisher z′=2.2, p=0.02)。两图横轴同为物体颜色概率、纵轴为群体平均放电率。这张图把"物体—颜色绑定"的皮层源头约束到颜色偏置结构内部,支撑主结果 5 末条与讨论中"颜色运算始于 V4/IT"的推断。
讨论
作者的讨论把结果接回"颜色是为何"的大问题:颜色不告诉我们物体是什么,而告诉我们该不该在意它——香蕉一生中形状几乎不变而颜色大变,形状给出身份、颜色给出价值(valence)。据此提出双系统猜想:IT 内可能一部分网络用形状算身份、另一部分网络用颜色算关注度,颜色可充当"调度器",把昂贵的形状识别资源分配给最可能有行为价值的位置。对 animacy 组织原则,作者指出既往归因于语义或形状特征的 IT 组织,可能部分来自动物与非动物物体之间系统性的颜色差异(或天然/人工着色的差异);L-M 暖色信号在人类与猴面孔中传递社会信息,作者推测社会性重要刺激的暖色在演化或发育中参与了 IT 组织的塑造。作者明确承认局限:结论依赖 MSRA 图像集——照片不是自然场景的客观随机样本(含摄影师、微软筛选者、掩膜作者三层决策),需在其他大图像集上重复、检验物体判定任务差异的影响,并需在更大的脑样本(含人脑)及对彩度的敏感性上继续检验;92 张图的 Kriegeskorte 集也可能不足以揭示 v′ 偏置。与 Gibson 等 2017(颜色命名反映颜色使用)、Naselaris 等 2012(animacy 条带)、Lafer-Sousa & Conway 2013(颜色区夹在面孔与场景区之间)构成直接的互证网络。
一句话总结
这篇文章最打动我的是它把一个演化论命题做成了两段可检验的实证链:先是 2 万多张图证明"物体=暖色+高饱和"并非偶然,再证明 IT 的颜色调谐恰好对着这条统计偏置排布。就我自己的理解,L-M 轴承载"物体 vs 背景"、v′/彩度承载"动物 vs 非动物"的分工暗示颜色机制不是一锅端的低级特征,而是按行为功能分层使用的工具——尽管图像库与刺激集的双重局限提醒我们,这条链的每一环都还等着更大规模的复现。
审校与证据追溯 (Verification & Evidence)
图表审计结果
- Fig1: 提取质量
good,对齐度full,识别面板[A, B, C] - Fig2: 提取质量
good,对齐度full,识别面板[A] - Fig3: 提取质量
good,对齐度full,识别面板[A, B] - Fig4: 提取质量
good,对齐度full,识别面板[A, B] - Fig5: 提取质量
good,对齐度full,识别面板[] - Fig6: 提取质量
good,对齐度full,识别面板[A, B] - Fig7: 提取质量
good,对齐度full,识别面板[A, B, C] - Fig8: 提取质量
good,对齐度full,识别面板[A, B, C] - Fig9: 提取质量
good,对齐度full,识别面板[A, B]
关键事实与局限性声明
- 审校纠偏: {'location': '一句话定位', 'current_text': '物体比背景更暖、更饱和,而这正是灵长类三色视觉演化的压力所在', 'problem': '把相关性结果直接表述为演化压力的事实。原文措辞为 is consistent with the idea that trichromatic color vision evolved in response to a selective pressure to identify objects——是「与某假说一致」,非演化证据本身。', 'classification': 'OVERCLAIM', 'recommended_fix': '改为「与三色视觉为识别物体而演化的假说一致」之类的一致性表述。'} -> 评注:
- 审校纠偏: {'location': '图 4 图注解读', 'current_text': '支撑主结果 1、3 及三色视觉演化论点的关键证据', 'problem': '「关键证据」夸大了论证强度:ROC 结果只能证明物体/背景的颜色签名主要由 L-M 机制承载,对演化假说仅构成间接的一致性支持。', 'classification': 'OVERCLAIM', 'recommended_fix': '改为「为三色视觉演化假说提供一致性(而非决定性)支持」。'} -> 评注:
- 补充要点: Kriegeskorte 92 图集上的阴性/对照结果未完整呈现:线性分类器仅用色相时为机会水平 52.2%,仅用亮度(CIE L)56.5%,线性 L u′v′ 也无提升——正是这些失败支撑了「animacy 颜色信息是非线性的、主要由彩度承载」的论点,MD 只提到线性彩度 76.1% 与 RBF 81.5%,弱化了这一对照逻辑。
- 补充要点: DCNN 对照的重要限定未注明:原文明确指出 AlexNet 在彩色 ImageNet 上训练、特征提取用彩色原图,因此 DCNN 特征很可能同时含颜色与形状信息,并非纯形状基线;且 DCNN 对 inanimate 判对率仅 28.6%(低于其机会水平 53%),这一异常表现 MD 给了数字但未作任何说明。
- 补充要点: fMRI 分析样本不对称:两只猴的 TR 数差异较大(13,600 vs 7,072 TRs),Figure 8A 全皮层相关图仅展示 M1 一只猴;讨论中作者亦承认需在更大脑样本(含人脑)中检验,MD 讨论部分提了人脑但未提样本量小这一神经侧局限。