IT Literature Intelligence 终审版本 (VERIFIED) 论文编号:
226| 原始基线:V0_ZCODE_BASELINE| 语义审核:minor_revision| 图表审核:pass
Activity of Inferior Temporal Cortical Neurons Predicts Recognition Choice Behavior and Recognition Time during Visual Search
Mruczek · The Journal of Neuroscience · 2007 · Zotero itemID=2128
这篇文章做了一件 IT 研究里少有人做的事:在自由观看、带自发眼动的相对自然任务中,逐试次检验下颞叶皮层(inferior temporal cortex, IT)神经活动能否预测猴子"是否识别到了某个物体"以及"何时识别到"。作者设计了换靶试验(swap trials):在猴子把眼睛转向目标的那一瞬间悄然换掉目标身份,用猴子最后按的按钮反推它识别的是换靶前还是换靶后的目标。结果发现,对换靶前目标有选择性的 IT 神经元,放电率高低显著预测猴子的选择(群体选择概率约 0.62),且注视前放电水平还预测换靶试验中的反应时间——为"IT 直接参与自然行为中的物体识别"补上了一块直接证据。
研究背景
IT 神经元对复杂刺激的强选择性(Perrett 等 1982;Desimone 等 1984;Tanaka 1996)加上颞叶损伤对识别成绩的毁灭性影响(Gross 1973;Mishkin 1982),通常被拿来当作"IT 负责视觉物体识别"的证据。但这个因果链条在单细胞水平上其实大多是默认的:绝大多数 IT 研究不把神经反应与识别行为做逐试次关联,而且用外显反应做任务时猴子往往表现到天花板,没有行为变异性可关联。此前只有两条相关证据:Sheinberg & Logothetis(1997)用双眼竞争(binocular rivalry) paradigm 证明 IT 神经元活动跟随猴子的知觉报告,但双稳态刺激有"赢者通吃"的特殊性,结果能否外推到正常视觉存疑;Sheinberg & Logothetis(2001)又在视觉搜索中发现了反应时间与 IT 早期激活的负相关,但那个任务没有控制跳跃眼动(saccade)幅度和刺激阵列的确切组成,相关可能只是刺激配置差异造成的。缺口因此很清楚:需要一个人为可控、又尽量接近自然观看(自发眼动、无模糊刺激)的任务,把"选择"与"识别时间"两个行为量同时与 IT 神经元活动对上。
研究思路
作者的策略是把"自然性"与"可推断性"设计进同一个任务。猴子在伪随机彩色噪声背景上自由浏览含两干扰物一目标的阵列,找到自己认识的、与左/右手按钮关联的目标后按对应键;任务允许自由眼动,但阵列的对比度布局(周边 75%、中心 100%)诱导出高度刻板的扫视模式——先看向最近的干扰物停留,再发起一次"定向扫视"(targeting saccade)奔向目标。关键技巧是换靶:定向扫视期间触发,猴子因眼跳抑制(saccadic suppression)对突变不敏感,且换上的目标的手部关联恒与原目标相反。这样,猴子按左还是按右就直接告诉我们它是否在扫视前就已识别出外围目标(parafoveal 远约 6° 的目标)——把"识别与否"变成了可逐试次读取的二元变量。对每个记录细胞,先用被动观看筛选出四个刺激(一个有效目标、一个反向关联目标、两个干扰物),保证任何神经调节都可归因于有效目标的在阵与否。两种行为量对应两个分析:换靶试验上用 ROC 曲线下面积(即选择概率 choice probability)检验放电率预测选择;常规试验上用稳健相关(biweight midcorrelation)检验放电率与反应时间的关系;再用多个对照(刺激配置、注视前目标偏心率、注视时长)逐一排除眼动变量的混杂。
方法
两只雄性恒河猴(6 岁与 10 岁),左侧颞叶前部腹侧表面(前内侧颞沟外侧)记录,共 44 个充分分离的神经元(猴 S 25 个、猴 M 19 个),其中 2 个因对照组错误率过高被剔除。刺激库为 100 张日常物体彩色照片(1.5°×1.5°),50 张为目标(各 25 张关联左手/右手键),50 张为无关联干扰物;注视点 350 ms 后出现搜索阵列,猴子自由观看并按键取奖,正确即给果汁。分析用试次要求刻板扫视模式:先看向最近干扰物、再定向扫视到目标;换靶由眼位进入目标 5.25° 圆区触发,显示器在触发后平均 6 ms 内(1–11 ms)完成更换,实际对照光度二极管验证(误差 <100 µs);换靶未发生在扫视中段的试次(约 6.5%)剔除。每天的试验块中,2/3 用该细胞定制四图阵列、1/3 随机混入全库图像作对照;改为“每个试验块包含64次常规试验、64次换靶试验和50次控制试验,并以交错方式呈现;总体上约三分之二试次使用细胞定制的四图集合,其余使用全刺激库随机图像。”神经测量取以定向扫视起点为中心的 200 ms 窗口放电率——这是换靶目标最后一次能有效驱动该细胞的时间段。统计:换靶试验对每个细胞做 ROC 分析(置换检验≥1000 次,α=0.05 两尾);常规试验计算放电率—反应时间的双权中间相关系数(biweight midcorrelation,抗离群值);群体层面先把各细胞放电率标准化再合并;另用"迷你实验"(同一目标相对位置的单细胞试次组)排除阵列配置影响,用最小截尾多元回归(预测变量:标准化放电率、注视前目标偏心率、注视时长)与"逐步剔除极值"流程排除眼动变量影响。
主要结果
- 行为可信(图 3):换靶试验中,响应匹配换靶前目标的反应时间显著更短(平均 197 ms,可在定向扫视前完成运动编程)而匹配换靶后目标的平均 395 ms;该差异在全部 42 个记录会话都显著(平均 ROC 面积 0.92,逐会话 p<0.001)。非换靶试验错误率 ≤6%;为保证猴子不是"发现换靶就乱按",换靶恒定(左换左)与干扰物换目标试验中错误率分别 ≤2% 与 ≤10%。
- 换靶试验:对换靶前目标(即该细胞的有效刺激)的反应在定向扫视前爬升,且响应匹配换靶前目标时爬升更强(图 5、6A、B)。示例细胞的选择概率(ROC 面积):first-saccade 0.81、second-saccade 0.78(均 p<0.01)。逐一细胞:first-saccade 13/32(41%)显著,其中 92% 大于 0.50;second-saccade 12/29(41%),除一个外全大于 0.50。合并群体(标准化后):ROC 面积 0.62 与 0.61,均显著大于 0.50(p<0.0005)。
- 换靶效应不被眼动混杂解释(图 7):注视前目标偏心率在选择两方向间确有差异(ROC 0.39,p<0.001,响应匹配换靶前目标时眼睛离目标更近)但仅约 0.1°;注视时长差异仅约 2 ms。多元回归中标准化放电率是猴子选择的最强预测因子(β=0.203/0.186,p<0.001),偏心率与注视时长贡献小且不一致;分别报告两项控制:“匹配偏心率后,神经ROC为0.58/0.59;匹配注视时长后,first-saccade神经ROC为0.58,而second-saccade的注视时长原本即无显著选择差异。”迷你实验(控制目标相对位置)亦给出均值 ROC 0.58/0.59(p=0.0008/0.004)。
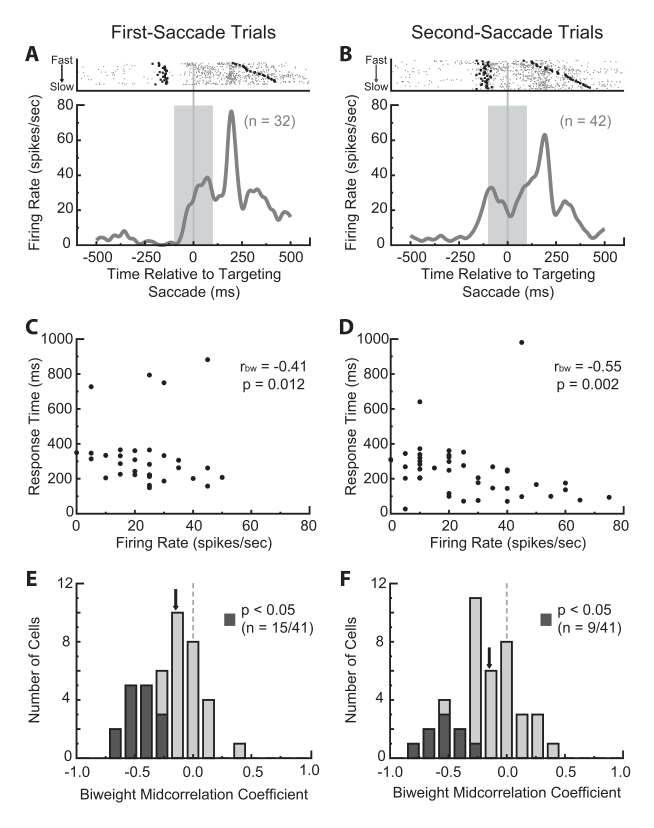
- 常规试验识别时间:放电率与反应时间(从目标注视到按键)呈稳健负相关(图 8)。示例细胞 rbw 为 −0.41(first-saccade)与 −0.55(second-saccade);群体中 15/41(37%)与 9/41(22%)的细胞显著负相关,无一个显著正相关;合并群体相关 −0.15(两种试验类型均 p<0.0002)。改为“扫视前IT活动越强,从目标获得到按键的反应时间越短;作者将其解释为更早完成目标识别,但该行为指标也包含决策和运动执行成分。”
- 一致性与特异性:42 个细胞中 24 个至少在一种分析中显著(8 个 ROC 与相关同时显著);逐细胞来看,swap 的 ROC 面积与 normal 的相关系数显著相关(first-saccade Pearson r=−0.55,p=0.0001;second-saccade r=−0.51,p=0.0006),说明两种测量在追踪同一"识别"过程。当换靶前目标对该细胞为无效刺激时,行为选择与神经反应无相关(群体 ROC 0.51,p=0.55;0.48,p=0.16)——效应特异于编码当前目标的神经元,排除了普遍唤醒或泛注意的解释。
图注解读
图 1 · 搜索阵列与两种试验的眼动模式
原文图注:Figure 1. Example visual search displays from first-saccade (A) and second-saccade (B) trials. For both trial types, search arrays could appear in one of four directions: left (A), right, up (B), or down. In both panels, the target is the wheelchair and the weight and the cards are distractors. For trials included in the analyses, the target was always placed at one of the more eccentric positions. The black trace denotes eye position. The saccade pattern shows an initial saccade to or fixation of the closest distractor followed by a targeting saccade. This pattern was typical of all trials included in our analyses. The * indicates the targeting saccade, during which the target identity was changed on swap trials (not drawn to scale for clarity; for details, see Materials and Methods).
读法:黑色轨迹是眼位记录:星星号处即定向扫视,换靶就发生在这里。A(first-saccade 类型)阵列中心贴初始注视点,猴子第一跳即可锁定目标;B(second-saccade 类型)阵列整体偏移 4°,使最近的一幅是低对比干扰物,第一跳必落在干扰物上、目标要第二跳才被注视。所有纳入分析的试次目标都在较偏心位置。此图定义了后文"扫视前 200 ms 窗口"对应的行为时段。
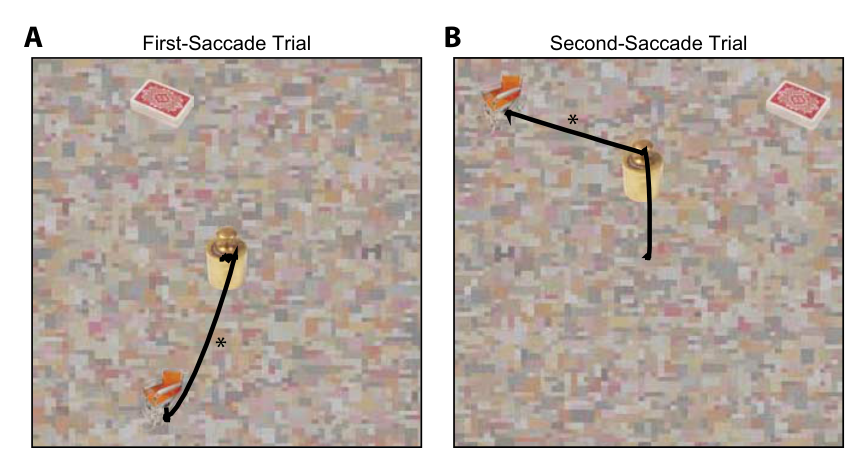
图 2 · 常规试验与换靶试验的流程对比
原文图注:Figure 2. Diagram depicting the difference between normal trials and swap trials. Eye position is denoted by the gray circle. A, On normal trials, the monkey fixated a distractor image (D) with the target (T; subscript denotes button association) in the periphery. A saccade was initiated toward the target at a time referred to as the targeting saccade onset. After target acquisition, the monkey made a manual response by pressing one of two buttons (left or right). Comparisons were made across trials with different response times (RT) measured from target acquisition to button press. B, On swap trials, the identity of the target was changed during the targeting saccade (*). Specifically, the identity was changed such that the preswap and postswap targets had opposite hand associations (here, right target swapped to left target). ……(截断)
读法:A、B 两栏分别画常规与换靶流程,灰色圆是眼位。关键差异在 B:目标身份在定向扫视(星号)期间改变,且新目标的手部关联与旧目标相反;于是"按左还是按右"成了识别时点的读数。这是理解结果 2 的逻辑前提——响应匹配换靶前目标,说明猴子在扫视前已从外围信息识别出目标。
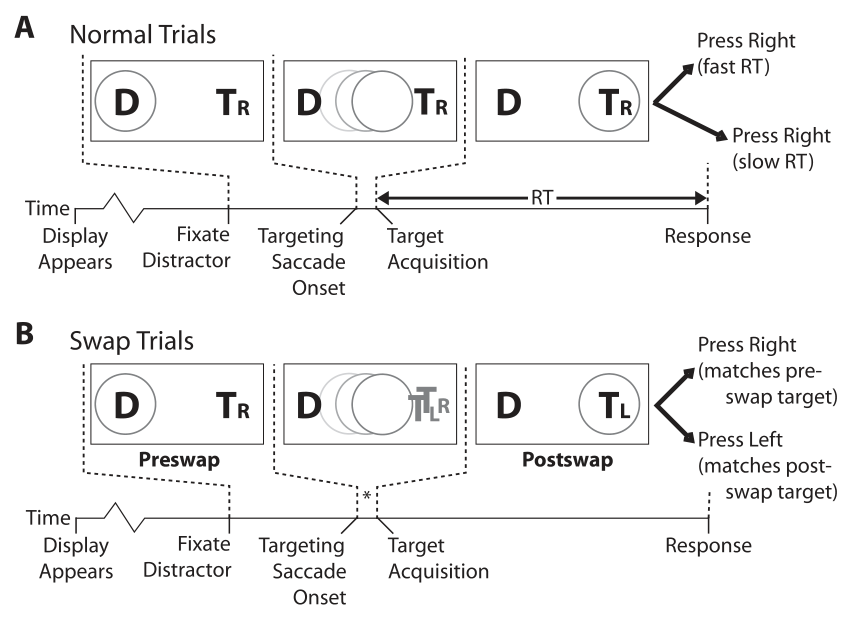
图 3 · 换靶试验反应时间分布按猴子选择分开
原文图注:Figure 3. Response time distributions for swap trials as a function of the monkey's response collapsed across all recording sessions. For each recording session, response times were significantly faster when the monkey's response matched the preswap target (p < 0.001). Trials with a response time >500 ms relative to target fixation are shown in the farthest right bin (<10% of the trials).
读法:直方图横轴为相对目标注视的反应时间,纵轴为试次数;匹配换靶前目标的分布(平均 197 ms)整体左移,匹配换靶后目标的分布(平均 395 ms)右移,且需要扫视后才出现的编码时间。逐会话 ROC 面积平均 0.92、全部 42 个会话 p<0.001。此图证明猴子的报告反映真实知觉而非敷衍策略,是后面一切神经—行为关联解释的信用基础(结果 1)。
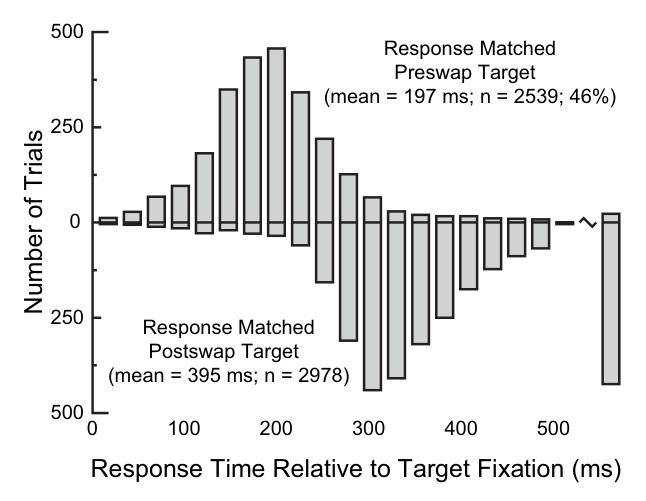
图 4 · 被动观看任务中的刺激选择性
原文图注:Figure 4. Neural response during a passive viewing task to assess stimulus selectivity for presented objects. A, Rasters and spike density functions for an example cell (same cell as in Figs. 6A–D and 8A–D). Activity is aligned to stimulus onset. On each day, one target (wheelchair here) was selected as an effective stimulus. A target with the opposite hand association (beaker here) and two distractors were chosen as ineffective stimuli. B, Population spike density functions showing average normalized response to effective target and ineffective target and distractors. The population of neurons was highly selective for the effective target.
读法:A 给出示例细胞(即图 5、6、8 的同一个"轮椅"目标细胞)对四个刺激的 raster 与平均反应,活动对齐刺激 onset;B 是全群体标准化后的平均反应:有效目标远高于反向关联目标与两个干扰物。该细胞池的平均选择深度(depth of selectivity)达 0.83(范围 0.43–1.0)。此图确立"有效目标"的筛选标准,使图 5–8 中可以把神经调节归因于外围换靶前目标的在场。
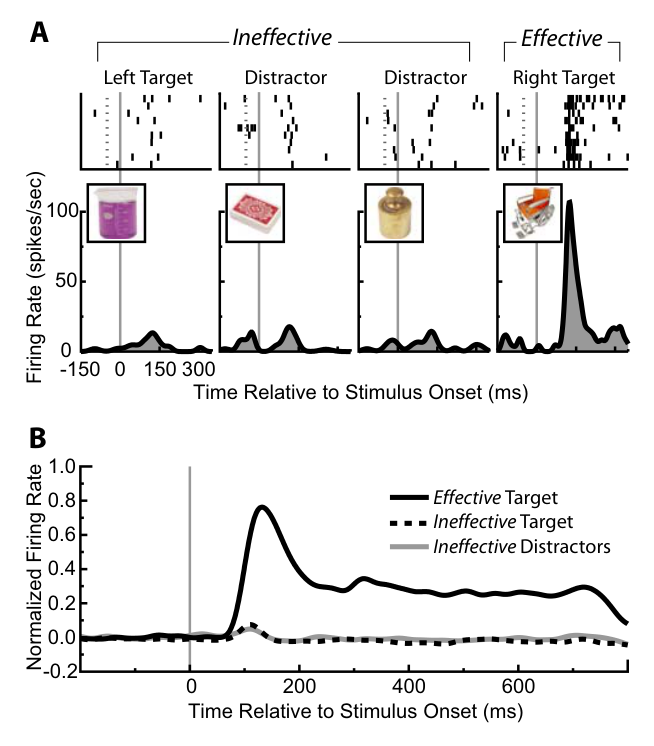
图 5 · 一个会话内的示例数据
原文图注:Figure 5. Example data from one experimental session. Note that, for simplification, only one of eight possible target positions is shown for both first-saccade (A) and second-saccade (B) trials. Left panels denote the monkey's eye trace during swap trials from the onset of the search array until the button press. Circled letters denote the position of distractors (D) and the target (T). Spike density functions depicting the response of a neuron selective for the preswap target (same cell in Fig. 4A) are shown in the bottom right panels. Top right panels show the fixation duration of the fixation preceding the targeting saccade (black circle; see Fig. 2B, left). Data in all panels are sorted by the monkey's response during swap trials.
读法:左侧为眼轨迹,圈出的字母标注干扰物 D 与目标 T 的位置;右侧上排是该次注视的时长、下排是细胞的 spike density。所有面板按猴子按键方向(即匹配前/后目标)分两类堆放,因此可以直接对比:匹配换靶前目标的试次不仅反应更快、神经反应更强。此图是结果 2、3 的"原始版",并引出"注视时长也可能混杂"的疑问,被图 7 正面处理。
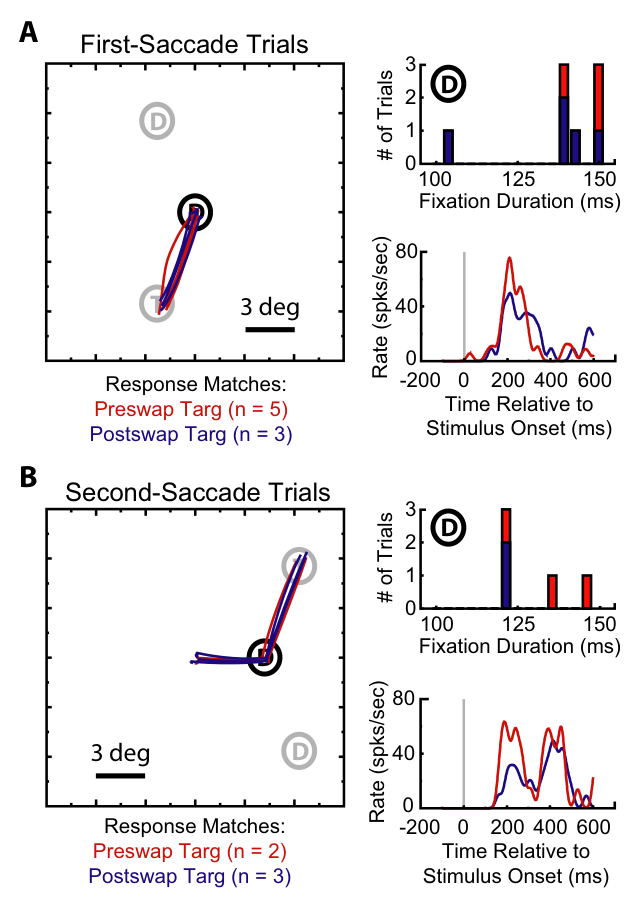
图 6 · 换靶试验的单细胞与群体 ROC 分析
原文图注:Figure 6. Swap trial analysis for first-saccade trials (A, C, E) and second-saccade trials (B, D, F) for an example neuron (A–D) and population (E, F). A, B, Rasters and spike density functions during swap trials in which the effective stimulus was the preswap target for an example neuron (same cell in Fig. 4A). Blue and red ticks denote spikes, and black ticks denote the beginning of the presaccadic fixation (left of 0) and time of manual response (right of 0). Activity is aligned to the onset of the targeting saccade. Note the presaccadic increase in activity, which was larger for trials in which the monkey's response matched the preswap target. ……(截断)
读法:A、B 中对齐 0 点的是定向扫视起点:扫视前活动爬升(响应匹配换靶前目标者更高),扫视后骤降——因为有效刺激在换靶中变成了无效刺激。C、D 为扫视周围 200 ms 窗口(阴影)的放电率分布,示例细胞 ROC 面积 0.81 与 0.78。E、F 为全群体的 ROC 面积直方图(深灰柱为显著个体;合并群体 ROC 0.62/0.61,p<0.0005,图中箭头标出)。此图支撑结果 2 的全部数字,是全文的核心图。
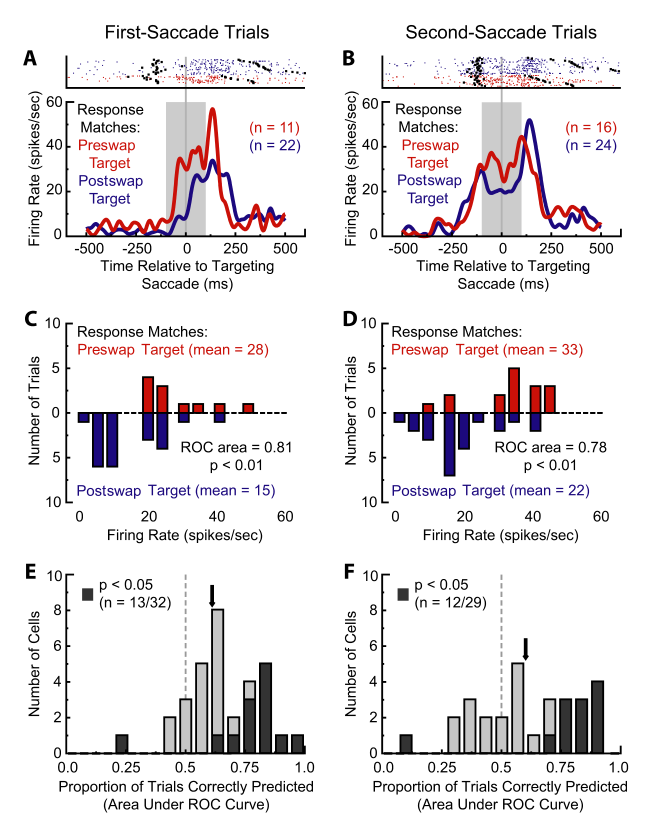
图 7 · 眼动变量在两种选择间的分布
原文图注:Figure 7. Distributions of presaccadic target eccentricity (A, B) and presaccadic fixation duration (C, D) across behavioral choice during swap trials. Upward and downward bars represent trials in which the monkey's response matched the preswap and postswap targets, respectively. Dark bars represent the subset of trials for which there was no significant difference across behavioral choice. For details, see Results.
读法:向上/向下柱分别代表匹配换靶前/后目标的选择。偏心率与注视时长本身确有跨选择的差异(偏心率 ROC 0.39、注视时长 0.46/0.52),但效应极小(0.1°、2 ms);深色柱是剔除极值后不再有差异的子集,在这些子集上放电率效应依然显著。此图支撑结果 3:换靶效应贴在"识别"上而不是贴在眼睛动得不同上。
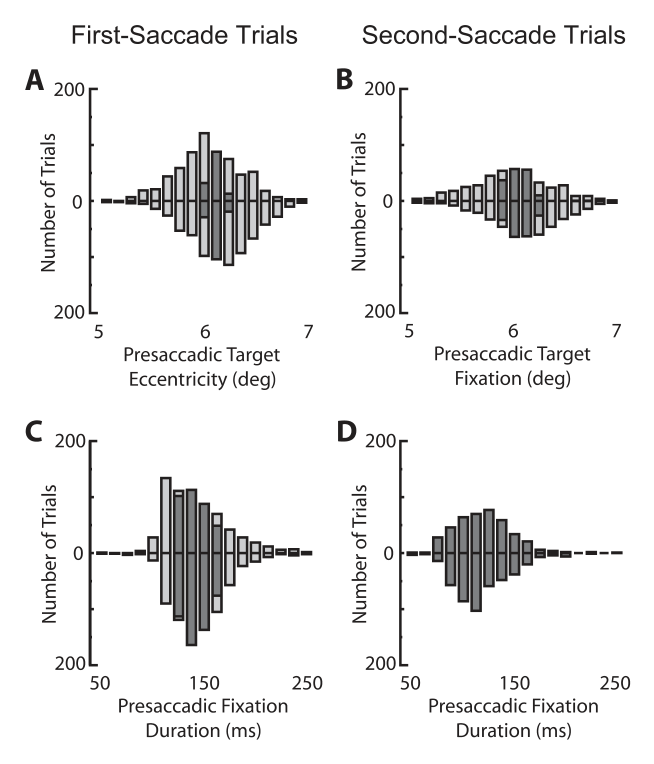
图 8 · 常规试验的放电率—反应时间关系
原文图注:Figure 8. Normal trial analysis for first-saccade trials (A, C, E) and second-saccade trials (B, D, F) for an example neuron (A–D) and population (E, F). A, B, Rasters and spike density functions during normal trials in which the effective stimulus was the target for an example neuron (same cell in Fig. 4A). Gray ticks denote spikes, and black ticks denote the beginning of the presaccadic fixation (left of 0) and response time (right of 0). Activity is aligned to the onset of the targeting saccade. There is a presaccadic increase in activity, followed by a transient peak after the saccade because the monkey fixated an effective stimulus (target) at this time. ……(截断)
读法:与图 6 相对的常规试验版本:扫视前活动爬升,扫视后因着陆点正是目标而出现瞬态峰。Raster 按反应时间排序(快试次在上),可见快试次的扫视前活动更强。C、D 以散点给出反应时间对 200 ms 窗口放电率的回归,示例细胞 rbw 为 −0.41/−0.55(均 p<0.05);E、F 为全群体相关系数直方图,合并相关 −0.15(p<0.0002)。此图支撑结果 4,也说明"放电率预测识别"在无换靶操纵的普通试次同样成立。
讨论
作者把结果放进两条参照系。一是选择概率研究传统:背侧通路(MT 区运动判别等,Britten 等 1992、1996)里 choice probability 已很成熟,腹侧通路却几乎空白(仅 Uka 等 2005 涉及);本研究的群体选择概率 0.60–0.62 处于已报道值的偏高区间,结合 IT 在视觉层级顶端的位置(Nienborg & Cumming 2006),提示 IT 输出正是物体身份决策的基础。二是与作者自己此前工作的对话:双眼竞争范式(Sheinberg & Logothetis 1997)固然证明相关,但多稳态知觉的赢者通吃机制可能放大选择概率,而本文刺激在测量时并不模糊,相关是在相同物理刺激条件下取得的;2001 年搜索研究发现的 RT 相关被阵列构成与扫视幅度混杂,本文用结构化阵列与刻板扫视仍得到 ~40% 细胞的显著相关。与 Eifuku 等(2004)、DiCarlo & Maunsell(2005)的"潜伏期—反应时间"研究的差异在于本文测的是反应幅度、且是在阈值附近的识别状态。作者承认的局限包括:单个细胞试次不多、ROC 是较敏感的度量,过半细胞未显著并不意外,符合 IT 身份由大群体编码的模型观(Tanaka 等 1991;Tsunoda 等 2001);注意的作用无法完全剥离——所有试次中注意都随定向扫视指向目标——但"无效目标处无相关"说明不能归因于一般性唤醒,选择与注意可能共享神经机制(Krug 2004)。作者还给出机制性解释框架:IT 群体随搜索进程累积物体身份证据,达到阈值即提交反应,身份信息可被前额叶等区域读出;并预期该范式适合做微刺激偏置选择行为的实验(Afraz 等 2006)。
一句话总结
在我看来,这篇文摘的说服力来自把"知觉决定"拆成两个互相独立的行为读数——换靶试验里的选择方向与常规试验里的反应时间——而同一个细胞的放电率同时咬合两者(逐细胞水平上两种指标显著相关)。0.62 的群体选择概率配上无效刺激处的零相关,让我觉得"IT 活动参与自然识别"这条老命题第一次拿到了开关变量式的证据;当然 200 ms 分析窗口的选取、以及注意本身被设计内置这一点,仍是留给后续微刺激类研究去压实的缝隙。
审校与证据追溯 (Verification & Evidence)
图表审计结果
- Fig1: 提取质量
good,对齐度full,识别面板[A, B] - Fig2: 提取质量
good,对齐度full,识别面板[A, B, D] - Fig3: 提取质量
good,对齐度full,识别面板[] - Fig4: 提取质量
good,对齐度full,识别面板[A, B, D] - Fig5: 提取质量
good,对齐度full,识别面板[A, B, D] - Fig6: 提取质量
good,对齐度full,识别面板[A, B, C, D, E, F] - Fig7: 提取质量
good,对齐度full,识别面板[A, B, C, D] - Fig8: 提取质量
good,对齐度full,识别面板[A, B, C, D, E, F]
关键事实与局限性声明
- 审校纠偏: {'overclaim_id': 'OVERCLAIM_001', 'current_text': '“IT 直接参与自然行为中的物体识别”以及“开关变量式的证据”', 'classification': 'OVERCLAIM', 'reason': '目标交换提供了行为时点推断,但没有操纵IT神经活动;神经证据是相关性的,不能被描述成因果开关。', 'recommended_fix': '统一改为“IT单细胞活动与识别选择及反应时间呈试次级相关,为IT参与识别提供汇聚支持;因果关系仍需微刺激、失活等干预验证。”'} -> 评注:
- 审校纠偏: {'overclaim_id': 'OVERCLAIM_002', 'current_text': '“说明两种测量在追踪同一‘识别’过程”', 'classification': 'INTERPRETATION', 'reason': '跨细胞ROC与反应时间相关系数之间的显著相关支持共同过程的解释,但不能唯一确定二者追踪的是同一个识别机制;注意、决策状态或其他共同变量仍可能参与。', 'recommended_fix': '改为“与两种指标部分共享识别相关神经过程的解释一致,但不能排除共同注意或决策变量。”'} -> 评注:
- 审校纠偏: {'overclaim_id': 'OVERCLAIM_003', 'current_text': '“排除了普遍唤醒或泛注意的解释”', 'classification': 'OVERCLAIM', 'reason': '无效目标条件的零相关削弱了非特异性全局唤醒解释,但不显著结果不能证明效应不存在,且作者明确保留目标特异性注意的可能。', 'recommended_fix': '改为“削弱了一般性唤醒解释,但不能排除目标位置或目标编码神经元特异性的注意调制。”'} -> 评注:
- 补充要点: : (第 9 页)
- 补充要点: : (第 5 页)
- 补充要点: : (第 11 页)