IT Literature Intelligence 终审版本 (VERIFIED) 论文编号:
127| 原始基线:V0_ZCODE_BASELINE| 语义审核:minor_revision| 图表审核:pass
Neurophysiological organization of the middle face patch in macaque inferior temporal cortex
Aparicio · The Journal of Neuroscience · 2016 · Zotero itemID=1313
这篇文章用一套新型立体显微 X 光定位系统,把数百个电生理记录位点精准地投回到清醒猕猴 fMRI 定义的中央面孔补丁(middle face patch, MFP)的高分辨率解剖 MRI 上,第一次在毫米与亚毫米尺度上直接量化了这一"面孔区"的大小、纯度(purity,面孔偏好位点的比例)及其空间组织。结论既支持大面积聚类——补丁直径约 6 mm、中心面孔偏好位点比例最高达 93%——又否定了"铁板一块"的模块假说:面孔选择性在补丁内部和邻近位点之间变化剧烈,整体呈中心向外单调衰减的梯度,极端面孔选择性的位点在补丁内出现的概率是补丁外的约 40 倍。
研究背景
早期视觉皮层具有精细的空间组织(如朝向柱),但高级视觉区域的空间组织至今不清。fMRI 在猕猴腹侧颞叶沿上颞沟(superior temporal sulcus, STS)发现了多个对面孔图像响应强于非面孔物体的"面孔补丁"(face patches,Tsao 等 2003),在多篇实验室报告中位置稳健的是位于后部 TE、STS 凸面上的中央面孔补丁;MFP 与人类梭状回面孔区(fusiform face area, FFA)因解剖位置相近而被认为可能同源。关于 FFA/MFP 内部结构存在两种对立假说:领域特异性(domain-specific)假说预期该区域由高比例面孔偏好细胞构成(高纯度),为面孔加工提供专属神经基质;分布式表征假说(Haxby 等 2001)则预期面孔细胞与物体细胞混合(低纯度)。关键在于,试图估计 MFP 面孔细胞比例的研究给出了非常分歧的结果——Tsao 等(2006)最初报告纯度近 97%,后续工作在 82%–94% 之间(Freiwald 等 2009;Freiwald & Tsao 2010;Ohayon 等 2012),而同样方法下 Bell 等(2011)只得到约 42%(他们估计记录打在了 fMRI 区域的边缘)。这一分歧被认为反映了 MFP 内部面孔细胞的空间变化,但当时的定位手段无法把它与记录本身的误差区分开。
技术瓶颈是明确的:既往电生理研究从脑背表面向腹侧深处的 MFP 进针,行程达 20–30 mm,微小的角度误差会被放大成穿透方向侧向的大偏差,电极对脑组织的压缩又造成纵向位移——空间误差与真实的空间变异混在一起,任何纯度估计都无法解释。要回答"MFP 到底多大、里面有多少面孔细胞、它们如何排布",必须先把每一个记录位点精确地放回皮层坐标系。
研究思路
作者的策略是用硬件而非统计来消除定位误差:先用清醒猕猴的 MION 增强fMRI(以单晶体氧化铁纳米粒子作对比剂)定位 MFP,再用定制的立体显微聚焦 X 光系统(Cox 等 2008,颅骨参考系下精度约 100 μm)重建每个记录位点的三维坐标,经线性与非线性配准(FLIRT/FNIRT)投到由 6–8 个高分辨率(500 μm)解剖 MRI 估计出的皮层中层面网格上,最后计算展平成近似等距的二维皮层图。在这张图上,问题被分解为三层:单个位点的面孔偏好如何量化(d' 与 FSI 两套指标互检);面孔偏好位点在二维空间中如何分布(用盒车 boxcar、各向同性/各向异性高斯三种模型拟合,估计补丁中心、半径与形状);邻近位点之间的选择性差异有多大(同一电极 500 μm 内的位点对,与重复噪声、图像抽样噪声两种期望变异比较),从而判断补丁是均匀模块还是梯度富集。整个设计是为"对 fMRI 定义的补丁做一次电生理普查"量身定做的。
方法
被试为两只猕猴(Macaca mulatta):M1(雄性,约 9 kg)与 M2(雌性,约 5 kg),均先做 MION 增强 fMRI 再做电生理。刺激是常规姿态、去背景并做过亮度归一化的陌生猕猴面孔与熟悉/不熟悉的日常物体图像;fMRI 用面孔-物体对比定位(15 张脸对 15 张物体;M2 的电生理用其中 10 对 10 的子集),只取对完整图像显著强于打乱图像的体素。清醒 fMRI(3T,1.25 mm 各向同性体素,图像 250 ms、间隔 500 ms、注视窗 3°–4°)在两只猴的 STS 下岸凸面上都找到后、中、前三个面孔补丁;MFP 覆盖颞下回(ITG)冠部、前后跨度约 5 mm。电生理用玻璃包裹钨丝微电极,在 STS 下岸及 ITG 凸面上以 200–500 μm 间隔逐点记录;RSVP 快速序列(M1:每试次 7–10 张、每张 200 ms 亮/100 ms 暗、每图重复 12 次;M2:12–15 张、100/100 ms、每图重复 3–5 次),注视窗 2°–3°,破注视试次作废。
分析上,多单元(multiunit, MUA)响应用刺激后 60–160 ms 的平均发放率(0–50 ms 基线扣除);位点面孔偏好用 d' = (μfaces − μobjects)/√((σ²faces+σ²objects)/2)(方差按单次呈现计)和 FSI = (μf − μo)/(μf + μo)(沿用此前文献惯例处理零响应位点)两种度量;拆半信度极高(d' 的拆半相关 M1 r=0.98、M2 r=0.92)。位点先投到中层面网格,投影位移超过 1250 μm 的被剔除(M1 约 14%、M2 约 25%;M2 分选单单元 53%),最后在以 fMRI MFP 中心为圆心、测地半径 7 mm 的二维展平皮层上分析(M1 有 425 个多单元位点,M2 有 565 个)。三种空间模型以最小二乘拟合位点位置与 d',参数用 bootstrap 估标准误;纯度(purity)定义为"达到面孔选择性标准的位点比例"随到补丁中心径向距离的变化,并以盒车半径划分 in(1 半径内)、near、far(2 半径以外)三个区带。M2 的多单元数据用 wave_clus 分选出 288 个单单元(SUA,信噪比 ≥5 倍标准)做对照;另按皮层带的上、下 500 μm 分别建模做层间比较。
主要结果
- fMRI 定位与电生理复现一致:两只猴的 fMRI 都在 STS 下岸凸面给出后、中、前三个面孔选择性团块,MFP 稳定落在 ITG 冠部(图 1);电生理在中央下颞区沿 ITG 找到一片面孔偏好位点富集带,两猴一致,作者称之为电生理定义的 pMFP(图 3)。区域内出现大片红(偏好面孔)位点的同时,也夹杂不少偏好物体的蓝位点与大小不一的中间值,面孔偏好 d' 在区域内变化明显,但拆半信度极高(r=0.98/0.92),排除了噪声解释。
- 补丁尺寸约 6 mm,三种模型都只解释约三分之一方差:盒车模型估计直径 M1 5.96 mm、M2 6.50 mm,各向同性高斯的 FWHM 为 5.70/7.10 mm,各向异性高斯的主/次轴 FWHM 为 4.45×2.55 / 4.10×2.20 mm(图 4)——与 fMRI 报告的尺度一致。三种模型拟合优度都只有 r²≈0.3(M2 的各向异性模型略好:0.33 vs 0.26),各模型中心位置一致(图 5),但一维径向剖面上大量位点偏离模型预测,说明毫米尺度梯度之下还有模型捕捉不到的精细结构(与 Issa 等 2013 报告的 IT 高频结构一致)。
- 邻近位点的选择性差异是真实的神经差异:同一穿透内相距 ≤500 μm 的位点对,面孔选择性的平均绝对差达 d' 1.04(M1)/0.75(M2)(图 6);按重复噪声(var2)与图像抽样(var3)重采样估计的期望变异远小于观测值,故补丁内部的不均匀性来自底层神经选择性的真实差异——这直接否定了"均匀模块"式补丁结构。
- 纯度从中心向外单调衰减:以 d'≥0.65(等价于 FSI≈1/3,即面孔响应至少两倍于物体响应;图 7 给出两指标的换算,424 个 d'≥0.65 位点中 422 个的选择性显著非零)或 FSI≥0.33 定义面孔选择性位点,补丁中心纯度最高可达约 96%(M1,FSI 指标、高斯模型;FSI≥0.33 口径下即摘要所说的 93%),到外围 3–3.5 mm 处降到约 50%,补丁外远处只剩 4%–8%(图 8)。用盒车分区量化:in 区 d' 纯度两猴平均 67%(M1 74%、M2 60%;FSI 口径平均 76%),near 区 16.5%,far 区仅 6%(图 8)。跨指标、跨模型的纯度空间剖面形状一致(图 10),M2 单单元数据虽整体 d' 略低于多单元、纯度更低,但衰减的空间范围相同(r=0.78,图 9)。
- 补丁内外的分布形状相似、只是整体移位并加宽:三区带的 d' 分布都显著非正态(KS 统计量 0.41/0.13/0.29,均 p<0.001),可用广义极值(GEV)分布拟合:in 区均值约为 far 区两倍,标准差由 far 的 0.54 升到 in 的 1.08(图 11)。极端选择性位点(d'≥2)只见于补丁内(约 24% 的 in 区位点),far 区一个都没有,按分布拟合外推其概率仅约 0.6%——即强面孔选择性位点在补丁内出现的概率约为补丁外的 40 倍。
- 移向补丁外时是"面孔响应整体走低"而非"面孔稀疏化":按排名-响应曲线(rank-ordered plot)分析,远离中心时对全部面孔图像的响应下降,对最佳非面孔图像的响应上升而对最差非面孔图像几乎不变(图 12);即使在补丁中心,最弱面孔图像的平均响应也略低于最佳物体图像的响应。上、下层位点的空间组织与选择性分布没有可见差异(图 13、14;M1 多采上部、M2 多采下部,跨猴结果仍一致)。
图注解读
图 1 · 用 fMRI 找到三个面孔补丁
原文图注:Figure 1. fMRI localization of face-selective patches. A, Conventional images of macaque faces and familiar everyday objects used to localize face-selective regions in the temporal lobe. Subsets of these images were also used in the neurophysiology experiments. B, Three fMRI-identified patches were found on the convexity of the lower bank of the STS. C, The MFP was observed consistently across both animals on the convexity of the STS (e.g., crown of the ITG). Only positive valued signal change to the faces-objects contrast is shown and only for voxels that were more significantly driven by the presentation of object images over scrambled versions of those images.
A 为定位所用的猕猴面孔与日常物体图例,B、C 为两只猴 STS 下岸凸面上的激活图。读图要点是 MFP 在两猴上的位置一致(ITG 冠部),且只有对完整图像响应显著强于打乱图像的体素才被计入面孔-物体对比,改为“该视觉响应掩膜降低了把非视觉驱动体素纳入面孔—物体对比的风险,但不能单独排除所有运动伪影或低级视觉特征混杂”。它是整个研究的"靶区定义图"。
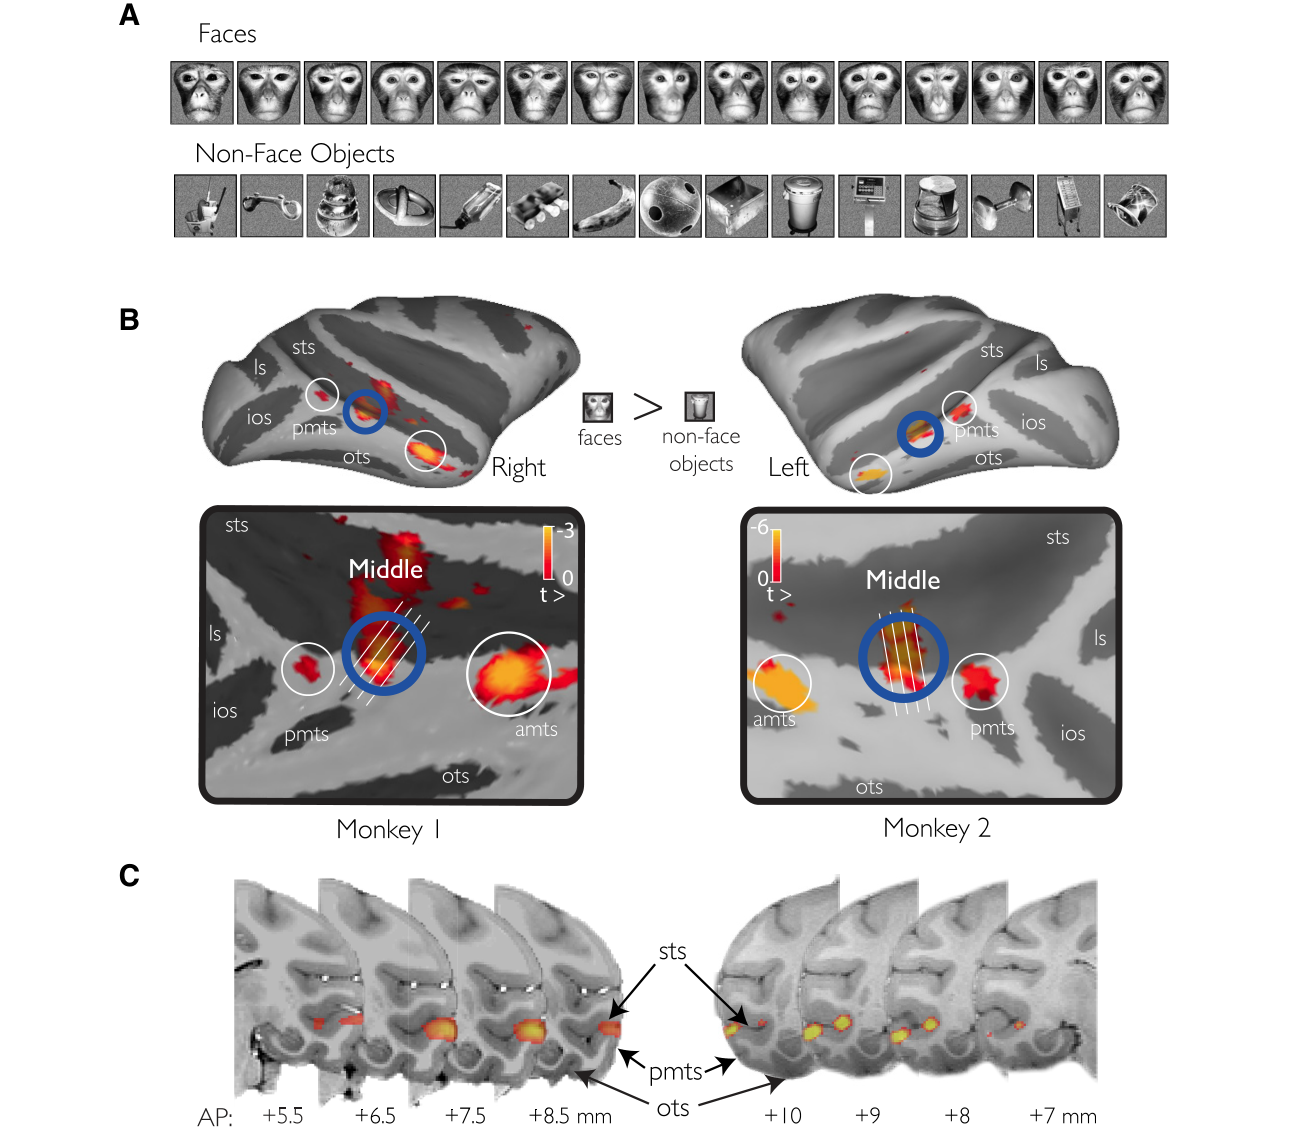
图 2 · X 光定位与皮层配准流程
原文图注:Figure 2. Spatial registration and analysis methods. The 3D spatial locations of all sampled sites in the MFP region were estimated with a custom-built stereoscopic x-ray imaging system. The 3D locations were registered (A, left) to a high-resolution (500 μm) anatomical MRI. Anatomical variability before (gray cortical ribbon; left, inset) and after neurophysiological recordings (blue cortical ribbon, left inset) can result in subpixel registration error. To improve the overall accuracy of the registration, nonlinear registration using FMRIB's FNIRT registration tool was performed (A, right), and the resulting transform was applied to the estimated positions of the recording sites (A, inset represents the overall spatial movement of sites projected in a 2D slice)…
这张方法图说明位点坐标如何获得:双 X 光源重建电极尖端三维位置 → 与颅架参考体积配准 → 经 FLIRT 线性 + FNIRT 非线性配准到解剖 MRI → 投影到皮层中层面网格,位移超过 1250 μm 的位点剔除;分析区是以 fMRI MFP 中心为圆心、测地半径 7 mm 的展平区域(避免并入后部 PL 或前部 AL 补丁)。读图时重点理解"为什么这套流程能把定位误差压到亚毫米"——这是全文所有空间结论可信度的根基。
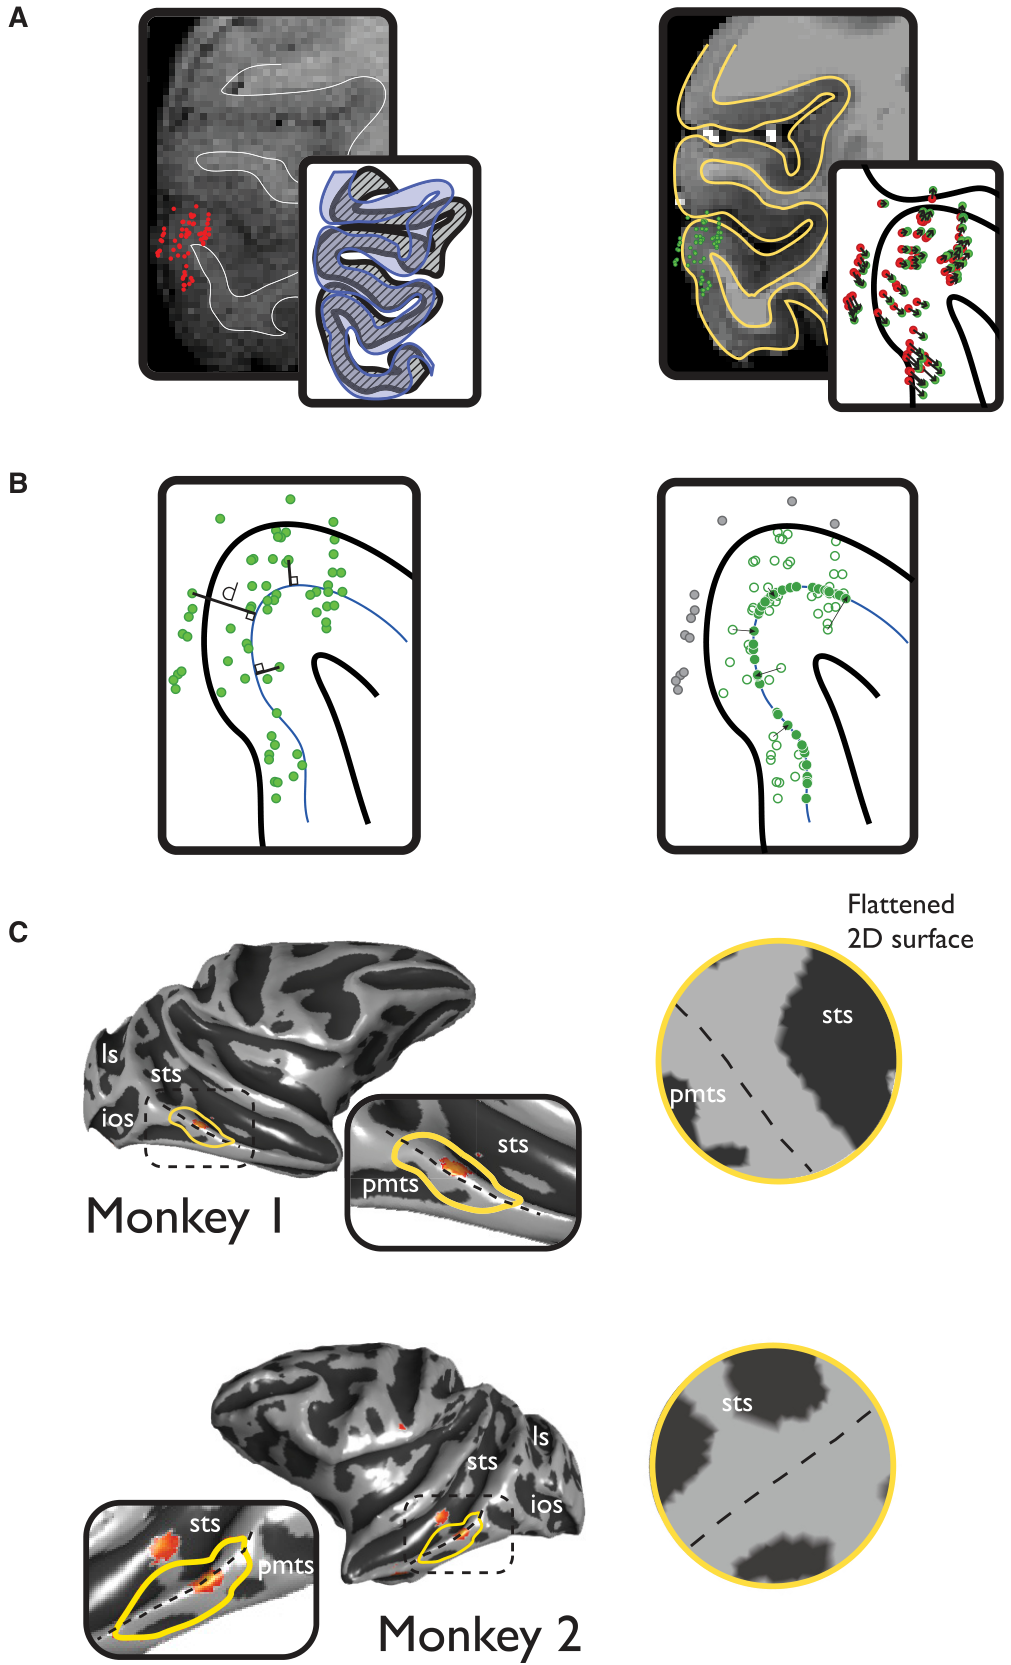
图 3 · 展平皮层上的面孔偏好位点分布
原文图注:Figure 3. pMFP contains an enrichment of face-preferring sites. A, Flattened 2D regions of the temporal lobe highlight category preference. Red represents sites that prefer faces over objects. Blue represents sites that prefer objects over faces. M1, n = 425; M2, n = 565 multiunit sites. The size of each circle represents the strength of selectivity at each site. B, Distribution of highly category-selective sites. Red or blue sites responded preferentially to faces (d' ≥ 0.65) or objects (d' ≤ −0.65), respectively. Yellow represents sites where the 95% CI of the site's selectivity metric fell within [−0.65, 0.65] and thus is not significantly above (or below) those two thresholds. Scale bars represent 1 mm.
A 图把每个位点画成展平皮层上的一个圆:红=偏好面孔、蓝=偏好物体、圆的大小=选择性强度;B 图只画高选择性位点(|d'|≥0.65,黄点表示 95% 置信区间未越过阈值)。读图要点:红色位点富集成带、位于 ITG 冠部,但带内混有蓝点与不同大小的红点——这就是"富集但异质"的直观形态,支撑主要结果 1 与 3。
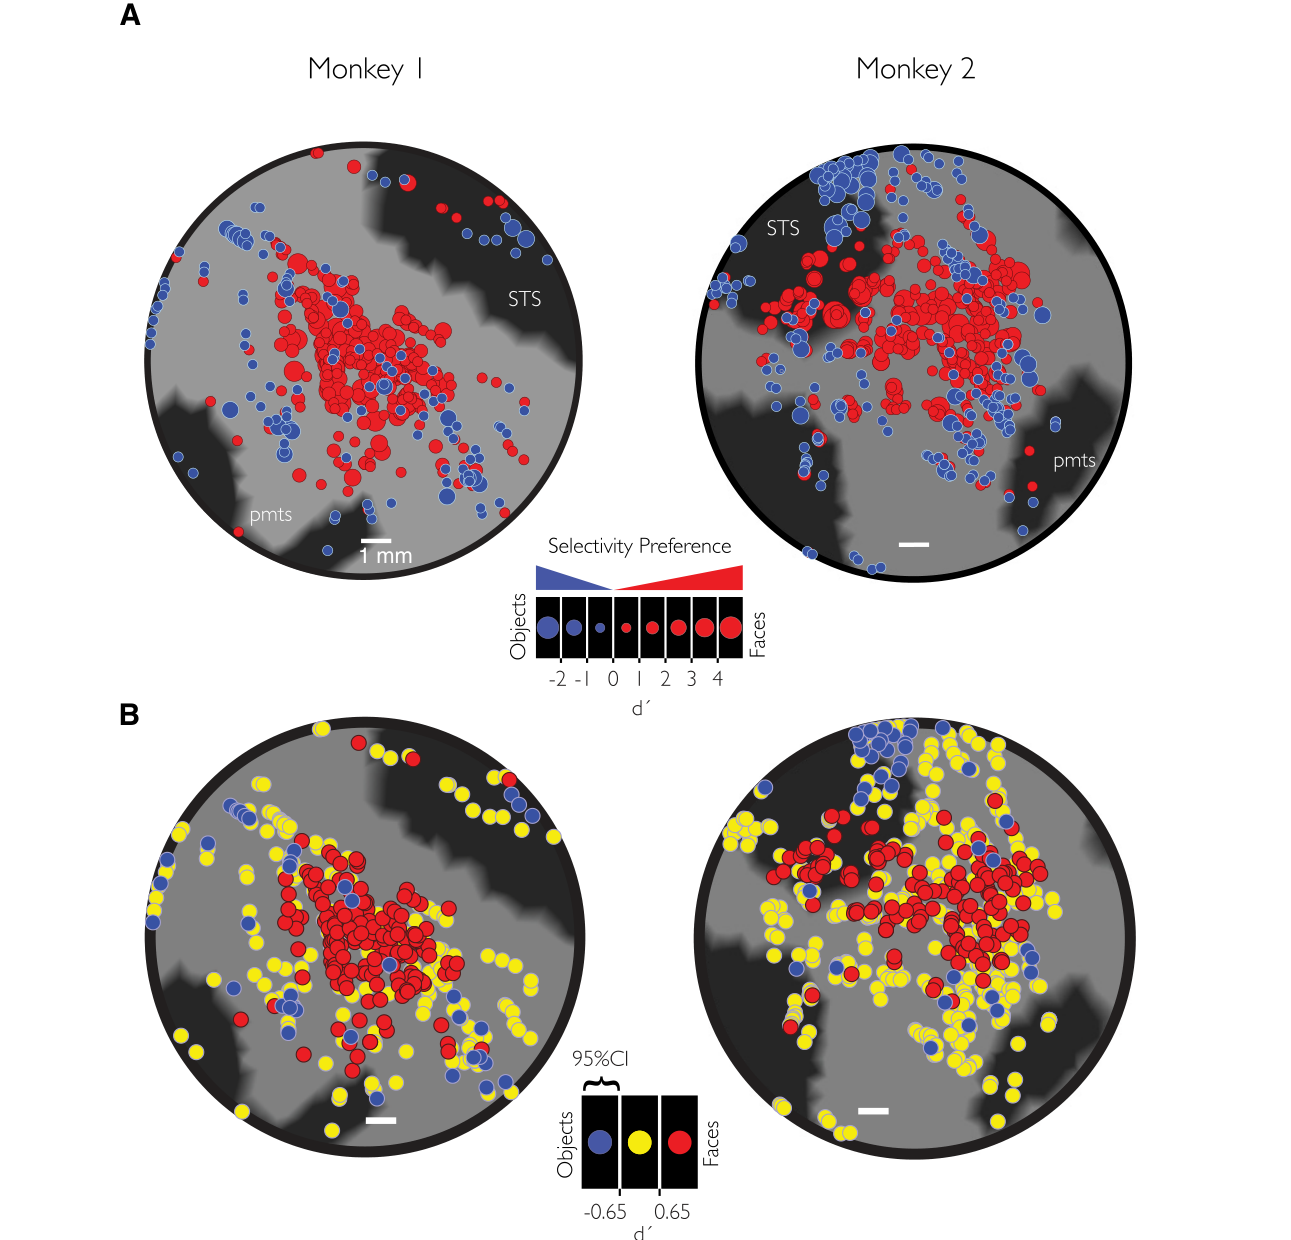
图 4 · 三种空间模型的拟合与径向剖面
原文图注:Figure 4. 2D models of the spatial organization of face selectivity on the pMFP. Three models (rows: box car, isotropic Gaussian, and anisotropic Gaussian) for the spatial structure of the pMFP were used to fit the category selectivity and 2D spatial position over all multiunit samples. Column 1 summarizes each model and their 2D spatial parameters (see Materials and Methods). Column 2 (monkey 1) and column 3 (monkey 2) summarize the results in each subject. The best fit models are displayed as outlines on the flattened 2D cortical maps (left) with the estimated size parameter for each model type underneath. In addition, the collapsed, 1D selectivity profiles (right) as a function of radial distance are shown (black dots represent individual sites), and the collapsed model prediction is overlaid in red…
行自上而下为盒车、各向同性高斯、各向异性高斯模型,各列给出拟合轮廓线与其尺寸参数(直径 5.96/6.50 mm;FWHM 5.70/7.10 mm;4.45×2.55 / 4.10×2.20 mm);右侧一维径向剖面中黑点为位点实测 d'、红线为模型预测。读图时既看轮廓大小(约 6 mm 的核心结论),也看黑点对红线的偏离——模型只解释了约三分之一方差,为"补丁内有高频结构"埋下伏笔。支撑主要结果 2。
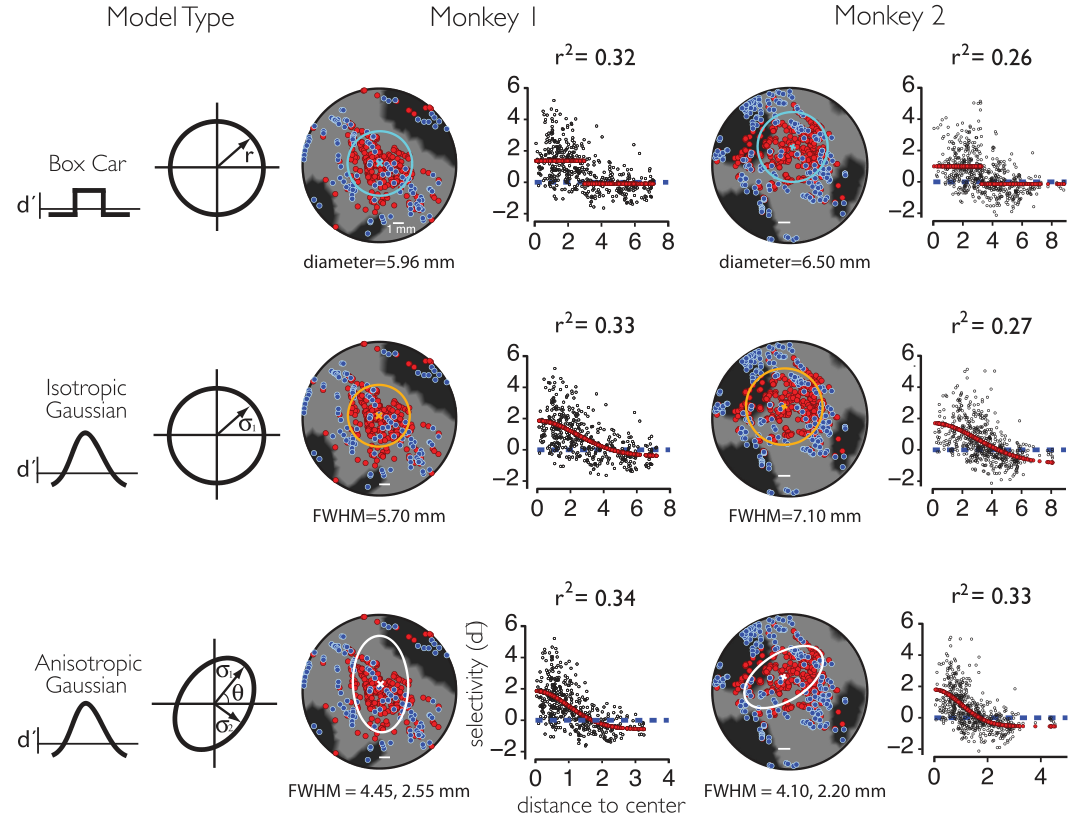
图 5 · 不同模型给出一致的补丁中心与范围
原文图注:Figure 5. Low-frequency 2D spatial models of the pMFP are largely consistent. The spatial location and category preference for each recording site are localized on 2D flattened surfaces of the fMRI-identified MFP region. The different best fit models from our analysis are largely consistent in their estimate of the center and the spatial extent of the enriched region. Scale bars represent 1 mm.
这张图把三种模型各自的最优轮廓叠在同一张展平皮层上:中心位置与空间范围彼此吻合。它的作用是稳健性检查——"约 6 mm 直径"不是某个特定模型的产物,而是低频结构本身的属性。支撑主要结果 2 的尺寸估计。
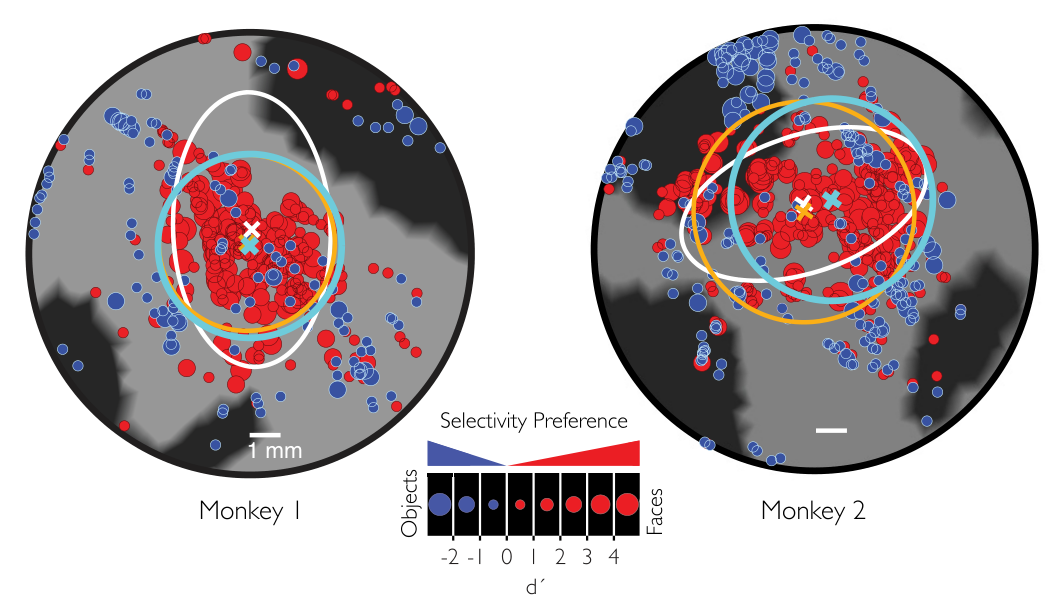
图 6 · 邻近位点间选择性的真实差异
原文图注:Figure 6. Variance in selectivity estimated at nearby spatial locations in the MFP. Bargraph represents the average squared difference in face selectivity between sites recorded on the same electrode and ±500 μm apart from each other. The average difference between sites expected simply from the use of a limited number of image exemplars or trials is also depicted for comparison. Error bars indicate the 95% CI on the estimate. Black and gray bars represent Subjects 1 and 2, respectively.
柱高为同一次穿透内相距 ≤500 μm 的位点对之间 d' 差的平方均值(黑=M1、灰=M2),并与仅由重复次数、图像抽样造成的期望变异对照。实测柱远高于两个期望柱,说明邻近位点的面孔偏好差异是真实的神经差异而非测量噪声。这张图是主要结果 3 的定量证据,也是否定均匀模块假说的关键。
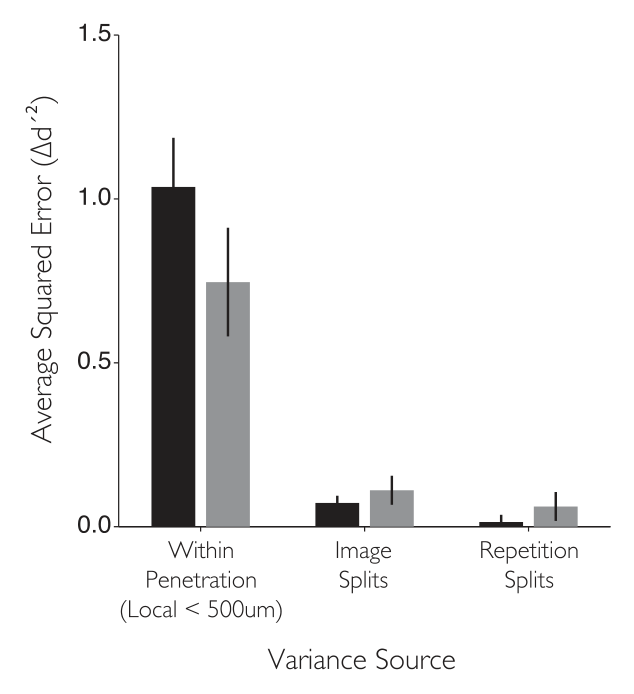
图 7 · d' 与 FSI 两套指标的换算
原文图注:Figure 7. Direct comparison of d' and FSI contrast metrics. Absolute values of d' depend critically on how one defines response variance (see Materials and Methods). The FSI metric displays an approximately linear relationship to selectivity measured with d'. In our data, an FSI ≥ 1/3 is equivalent to a range of d' values with a median of 0.65. Most of these sites with a d' ≥ 0.65 have a face image preference significantly different from zero (422 of 424 sites with d' ≥ 0.65 had a bootstrapped 95% CI ≥ 0).
横轴 FSI、纵轴 d',二者近似线性;FSI=1/3("面孔响应两倍于物体"的经典标准)对应的 d' 中位数是 0.65,这解释了后文阈值 d'≥0.65 的来源,且绝大多数达标位点的选择性经 bootstrap 检验显著非零。这张图保证纯度结论不依赖于选哪套指标。
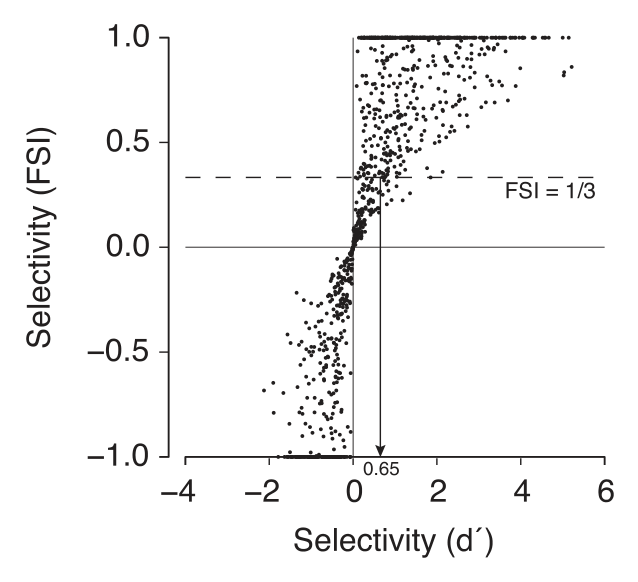
图 8 · 纯度随离补丁中心距离衰减
原文图注:Figure 8. Functional selectivity and purity estimates in the pMFP as a function of spatial size. Estimates of the fraction of category-selective multiunit sites in the MFP (the purity) could range from 94% to 58% depending on the distance from the center of the patch. These ranges varied due to both the model and metric used to define the patch. Purity estimates based on an FSI ≤ 0.33 led to higher overall purity estimates than those based on a comparable d'. Overall, the purity falls off gradually from the center of the patch to cortical regions outside the patch. Dotted lines indicate the radial average distance from the center, which defines the qualitative distance categories: "in," "near," and "far"…
横轴为到补丁中心的径向距离(点线标出 in/near/far 的分界,即按盒车半径的 1 倍与 2 倍),纵轴为面孔选择性位点比例(纯度),不同曲线对应不同的模型×指标组合。读图要点:所有曲线都从中心高位单调滑落——中心最高约 96%(FSI 口径)/约 78%(d' 口径、多单元),外围约 50%,远处背景 4%–8%;in/near/far 三区带纯度分别平均 67%/16.5%/6%(d' 口径)。这是全文核心结果图,支撑主要结果 4。
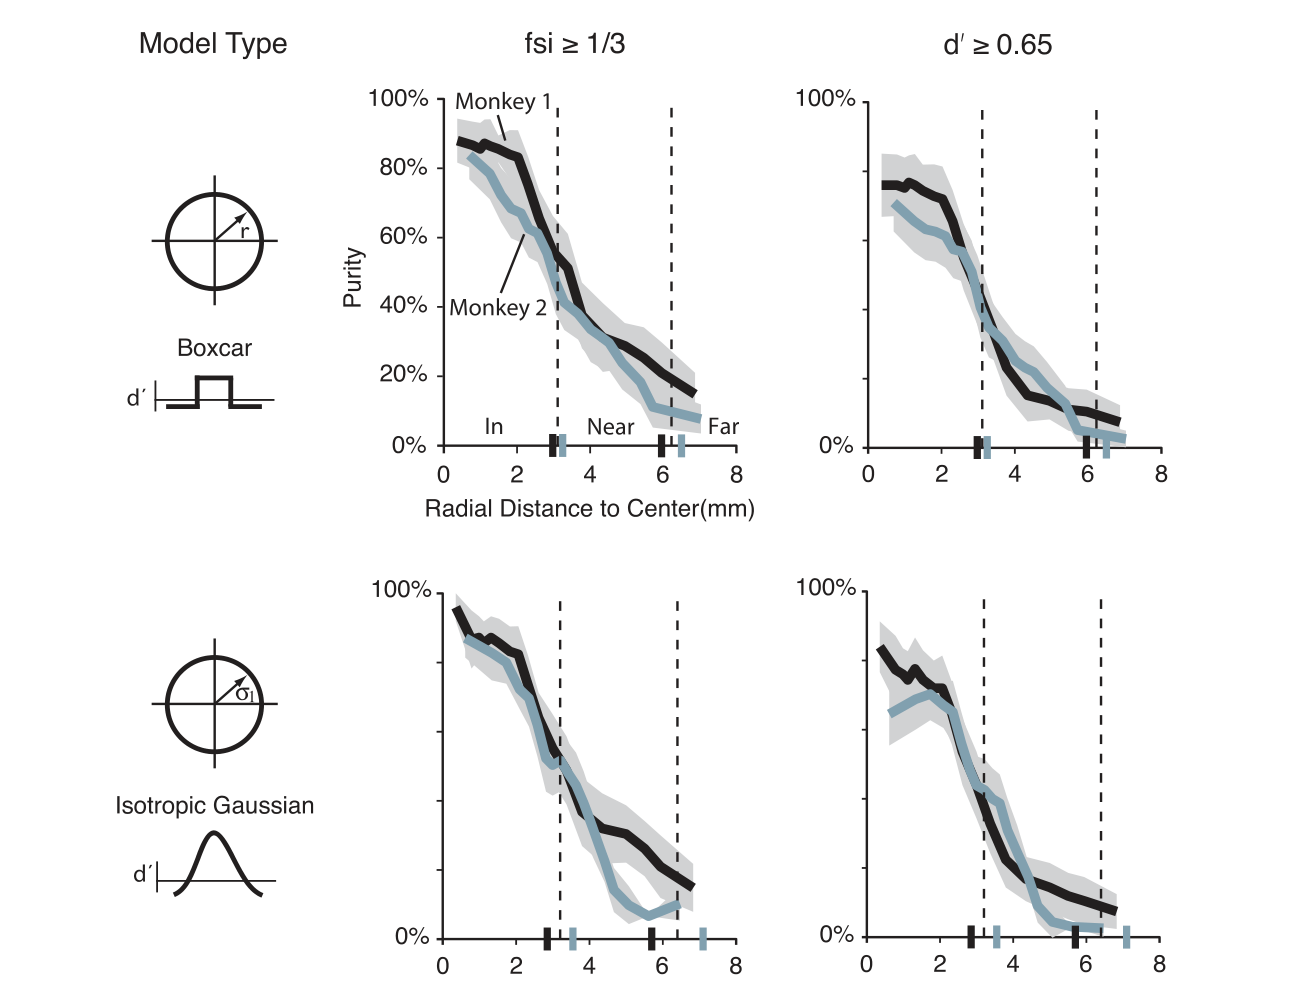
图 9 · 单单元与多单元的纯度剖面一致
原文图注:Figure 9. Comparison between single-unit and multiunit purity estimates in the pMFP as a function of spatial size. Spike waveforms from Subject M2 were sorted to provide SUA. Using the center of the isotropic Gaussian model fit to the MUA data, we plotted the fraction of face-selective sites (purity) for both MUA (gray line) and SUA (black line) as a function of distance from the center. In both cases, a site was defined as face-selective if its d' was ≥ 0.65. Both MUA and SUA produced a gradual fall-off in purity over a similar spatial range, although MUA data showed slightly higher d' values and thus slightly higher purity estimates…
用 M2 的 288 个单单元(SUA)与同一数据的多单元(MUA)分别计算纯度随距离的剖面(1 mm 滑动窗、最少 5 个位点;d'≥0.65 标准)。两条线都在相同的空间范围内渐降,说明梯度结构不是多单元信号混合的伪影;MUA 的 d' 略高、纯度略高也如实注明。支撑主要结果 4 的稳健性。
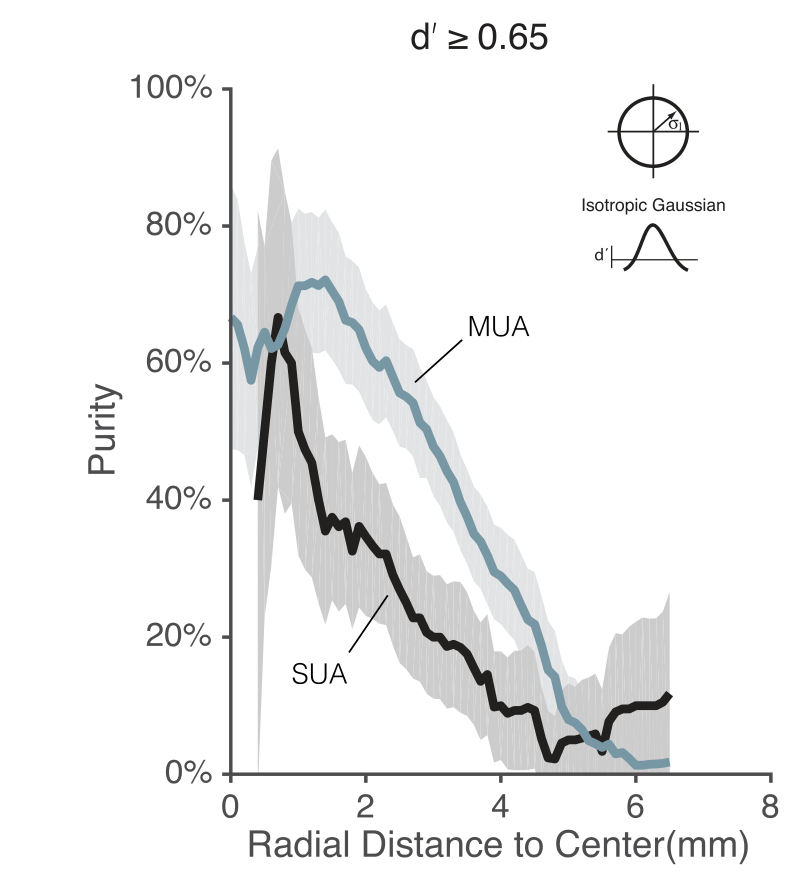
图 10 · 跨动物合并的平均纯度剖面
原文图注:Figure 10. Average spatial profile of the number of face-selective sites in the pMFP. We estimated the purity collapsed across both animals using the estimated center from the isotropic Gaussian spatial model. The empirical purity function across both animals is remarkably consistent in shape across different selectivity estimators. The plot represents the proportion of face-selective sites across both animals under various criteria for face selectivity. Not surprisingly, weaker thresholds resulted in higher estimates of the purity near the center and far outside the pMFP.
把两猴位点按各向同性高斯模型的中心合并计算纯度剖面,多组面孔选择性阈值各给一条曲线。形状高度一致、只是阈值越松整体越高,说明"中心富集、向外衰减"的形状对判据选择不敏感。与图 8 相互印证,支撑主要结果 4。
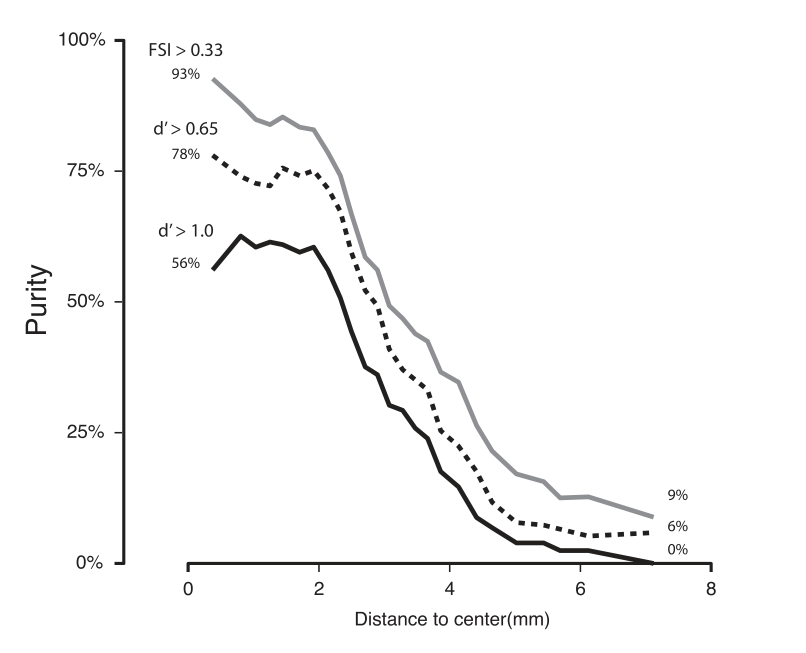
图 11 · 补丁内外面孔选择性分布的比较
原文图注:Figure 11. Distributions of face selectivity inside and outside of the pMFP. A, Distributions of the estimated face selectivity from multiunit samples in and out of the pMFP have similar distributional forms but are mean shifted and differ in their variability. B, Units outside the pMFP (light gray) appear to occupy a relatively narrow range of category-selective values (at least for this image set), with the majority of values near zero, whereas sites in the pMFP (black) are characterized by a broad range of selectivity and extreme positive values.
A 图比较 in、near、far 三区带的 d' 分布(GEV 拟合参数:均值 μ=0.69/0.48/0.52,标准差 σ=1.08/0.78/0.54),三者的分布形状相似但均值与宽度不同;B 图叠加显示补丁外分布窄、集中在零附近,补丁内分布宽、长尾延伸到极端正值(24% 的位点 d'≥2,far 区为零,按外推补丁内强选择性位点富集约 40 倍)。这张图把"补丁=分布整体右移并加宽"的定量刻画交给读者,支撑主要结果 5。
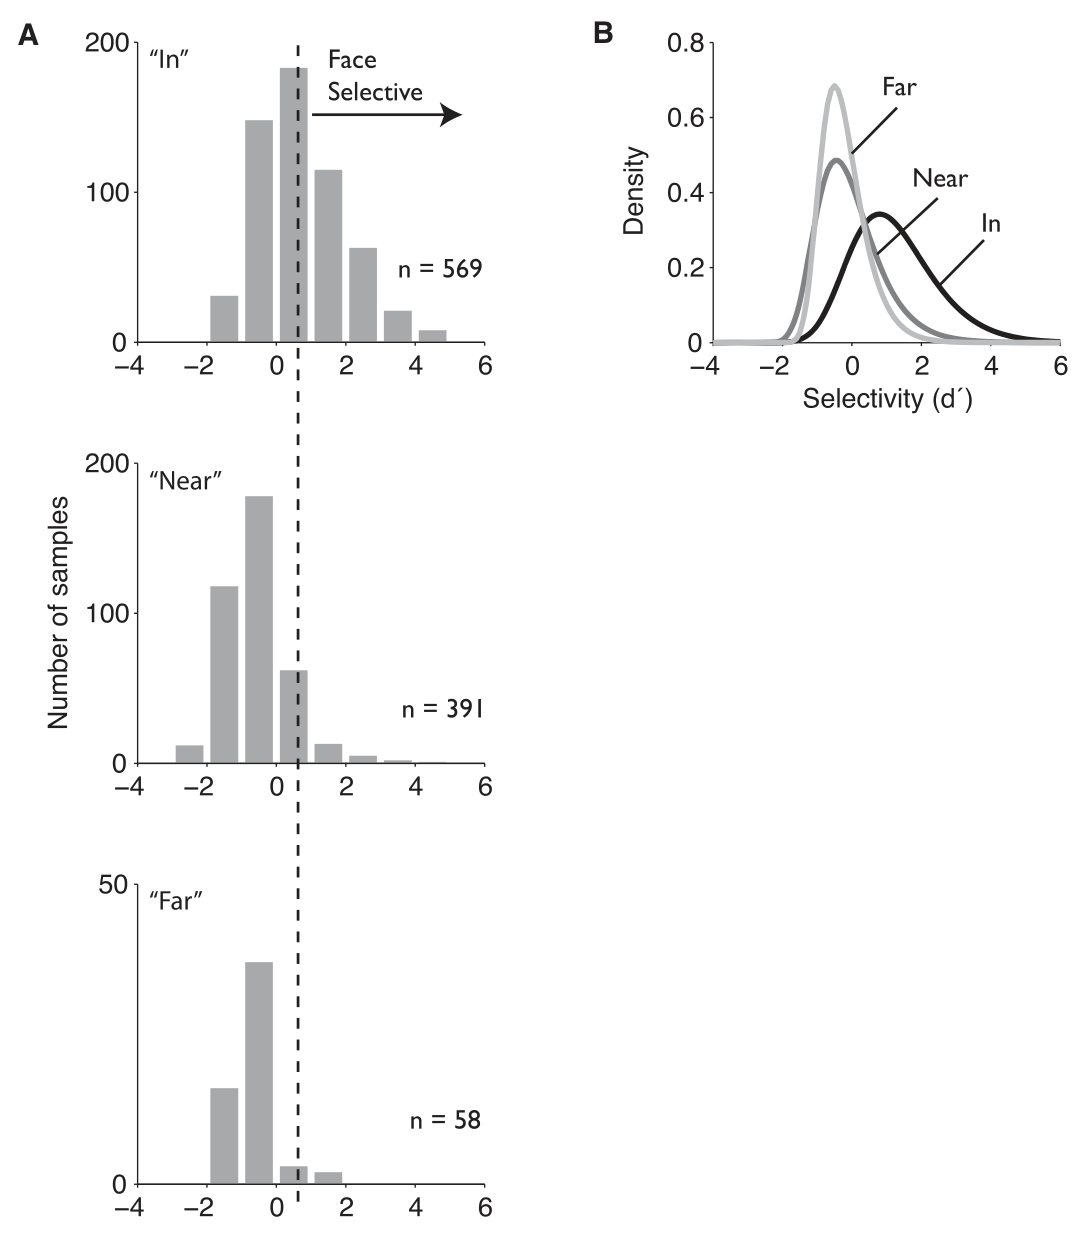
图 12 · 补丁内外的图像排名-响应曲线
原文图注:Figure 12. Selectivity across face and object images inside and outside the pMFP. Site-by-site image responses were normalized by the site's maximum absolute response across all images and then ranked using independent data (within face or nonface image groupings; see Materials and Methods) before averaging over all sites and both monkey subjects in each of the three anatomical regions described previously ("In," "Near," and "far"; based on distances of 1 and 2 SDs of the fit isotropic Gaussian model). The responses to all face (black curves) and nonface objects (blue) are shown for sites in the "in," "near," and "far" regions. In the pMFP, the best driving face image gave a greater response than the best driving object exemplar; and outside the pMFP (middle and right panels), the response to the best driving face image was far exceeded by the response to the best driving object exemplar. To prevent any bias, images were rank-ordered on a held-out set of trials, and the remaining trials were used for plotting rank-ordered responses.
横轴为图像排名(黑=面孔、蓝=物体,各自组内从最响到最不响),纵轴为归一化响应。读图要点:in 区的最佳面孔图像响应高于最佳物体图像;near/far 区反过来,最佳物体远超最佳面孔;且远离中心时是全部面孔响应走低、只有最佳物体响应升高。这排除了"补丁外仍有少数面孔专家细胞支撑高响应"的稀疏化解释,支撑主要结果 6。
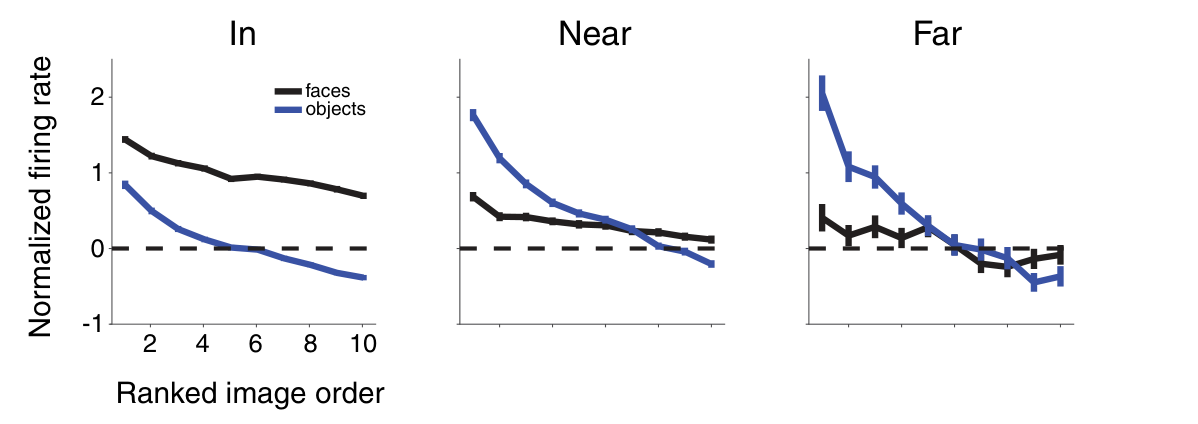
图 13 · 上层与下层位点的空间分布
原文图注:Figure 13. Upper and lower regions of the cortical ribbon show similar selectivity profiles. Dividing sites that could be reliably (see Materials and Methods) localized in the "upper" or "lower" layers did not reveal additional spatial structure. For comparison, sites localized to within 1 mm of the middle of the cortical ribbon were used to create a "middle layer." These sites could overlap upper and lower layer sites. A, Monkey 1. B, Monkey 2. Scale bars represent 1 mm.
把可信定位到位点按皮层带上层(软膜下 500 μm)与下层(白膜上 500 μm)分开重新画在展平皮层上(另设可重叠的"中层"作对照)。读图要点:两层都呈现同样的中心富集形态,没有发现随深度变化的额外空间结构。它是二维假设(面孔选择性沿皮层切向变化)的 3D 检验,支撑主要结果 6 的层间结论。
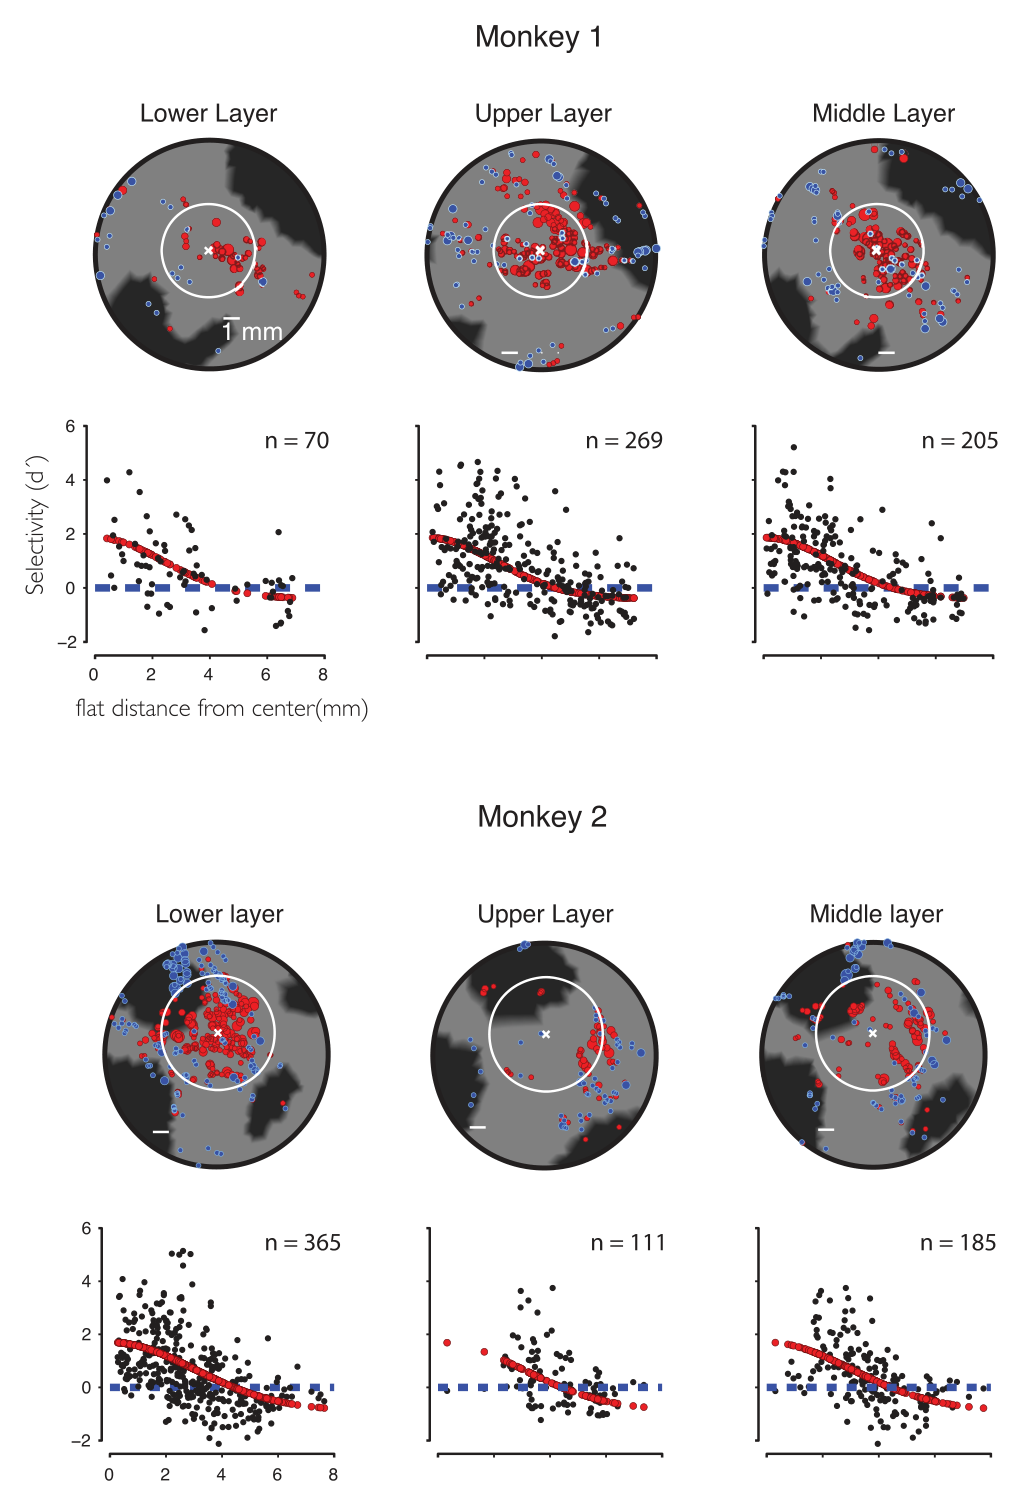
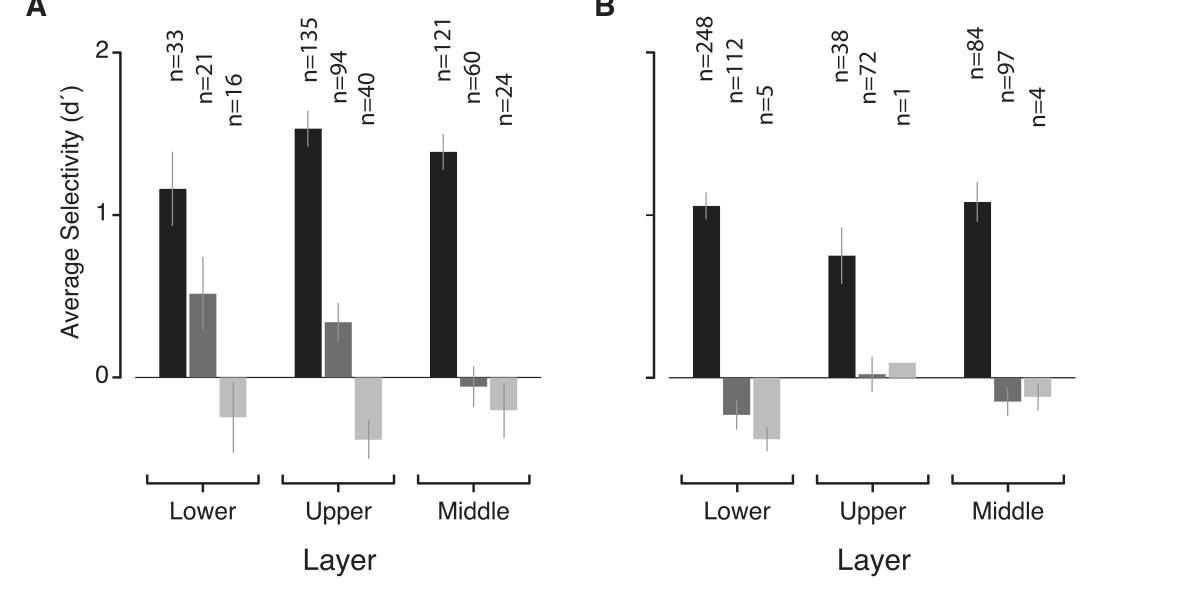
图 14 · 上、中、下层的平均选择性比较
原文图注:Figure 14. Face selectivity estimates for upper, lower, and middle cortical layers. Separating sites by upper and lower layers produces similar selectivity estimates of the average selectivity in the "in," "near," and "far" regions (black, dark gray, and light gray bars, respectively), in either subject (A: Monkey 1; B: Monkey 2).
A、B 分别为两猴:横轴 in/near/far 三区带,黑、深灰、浅灰柱分别为上、中、下层位点的平均面孔选择性。各层的柱形走势一致(in 最高、向外降低),说明面孔偏好的径向梯度在层间近似成立,没有明显的层特异性组织。支撑主要结果 6 与讨论中"二维建模假设成立"的辩护。
讨论
作者把长期文献分歧——Tsao 等(2006)的近 97% 纯度与 Bell 等(2011)的约 42%——归结为采样位置不同加上定位误差:用他们的框架看,"只打到补丁中心"的研究会得到极高纯度(FSI≥0.33 口径中心可达 93%–96%),"打到边缘"的研究自然偏低,而两者都只看到了同一个渐变剖面的不同段。这意味着对强模块假说的直接否定:不存在一个"全部由面孔细胞构成"的离散区域,MFP 的本质是中心峰加单调衰减的梯度分布,且补丁内部还有简单模型(解释仅约 1/3 方差)无法刻画的高频结构。在机制层面,作者给出两种非互斥的解释:高频结构可能对应某种真实世界图像特征的地图(如头姿——光成像曾观察到视角相邻排布、彼此重叠的激活斑,Tanaka 等 1991;Wang 等 1996/1998),也可能只是执行面孔检测/判别任务的层级网络在性能优化后自然出现的单元多样性(Yamins 等 2014 的分布式编码观点);后一点与"补丁中心最弱的面孔图像响应仍低于最佳物体响应"的观察一致(也呼应 Kiani 等 2007)。方法学上作者坦承局限:图像集很小(10 张全正脸)、d' 的方差定义影响绝对值(故补丁外约 10% 位点在 FSI 口径下也算"面孔细胞",任何纯度数字都依赖口径)、深度方向的定位误差与组织形变限制层分析的可靠性、而且本研究测量的是相关性组织而非因果作用——需要用群体读出与光遗传抑制(Afraz 等 2015;Majaj 等 2015)进一步检验 MFP 群体在行为中的作用。他们也解释了自己得到的 6 mm 聚集为何大于既往 IT 特征聚集的 ~1 mm 量级:记录位置偏后、用电生理而非光成像、以及"面孔 vs 物体"这一宽对比给了更大的信号动态范围;两套技术应视为互补。
一句话总结
(依我的理解)这篇文章的分量在于把一个被争论了十年的数字问题——"面孔补丁里到底有多少面孔细胞"——换成了一个分布问题:答案不是单一纯度,而是从中心 90%+ 到外围背景值的连续梯度加上补丁内的毫米级异质结构。我读下来最欣赏的是方法诚实度:X 光亚毫米定位消掉了既往研究的最大混杂,d'/FSI 双口径、单/多单元双检验把每个数字的口径都摊开在桌面上。它没有推翻面孔补丁的存在,但确实给"专门化模块"的浪漫想象泼了冷水——用作者自己的话说,补丁内的神经元编码的可能是"丰富的面孔信息,甚至还有其它物体"。
审校与证据追溯 (Verification & Evidence)
图表审计结果
- Fig1: 提取质量
good,对齐度full,识别面板[A, B, C] - Fig10: 提取质量
good,对齐度full,识别面板[] - Fig11: 提取质量
good,对齐度full,识别面板[A, B] - Fig12: 提取质量
good,对齐度full,识别面板[] - Fig13: 提取质量
good,对齐度full,识别面板[A, B] - Fig14: 提取质量
good,对齐度full,识别面板[A, B] - Fig2: 提取质量
good,对齐度full,识别面板[A] - Fig3: 提取质量
good,对齐度full,识别面板[A, B] - Fig4: 提取质量
good,对齐度full,识别面板[] - Fig5: 提取质量
good,对齐度full,识别面板[] - Fig6: 提取质量
good,对齐度full,识别面板[] - Fig7: 提取质量
good,对齐度full,识别面板[] - Fig8: 提取质量
good,对齐度full,识别面板[] - Fig9: 提取质量
good,对齐度full,识别面板[]
关键事实与局限性声明
- 审校纠偏: ISSUE_003
- 审校纠偏: ISSUE_004
- 审校纠偏: ISSUE_005
- 审校纠偏: ISSUE_006
- 补充要点: Figure 4所列方差解释率没有按神经测量噪声校正,因此“约三分之二未解释方差”不能全部直接归为精细空间结构。
- 补充要点: Figure 11的in、near、far样本量分别为569、391和58;far区样本较少,约40倍富集结论依赖GEV分布对未观察到的极端事件进行外推。
- 补充要点: fMRI定位实验还包含身体、场景和打乱面孔等刺激类别;面孔补丁的核心定义仍是视觉响应掩膜内的faces-versus-objects对比。
- 补充要点: 实验任务是维持注视而非主动识别或分类,因此结果描述的是被动观看条件下的神经选择性组织,不能直接推出行为任务中的功能贡献。