IT Literature Intelligence 终审版本 (VERIFIED) 论文编号:
234| 原始基线:V0_ZCODE_BASELINE| 语义审核:needs_revision| 图表审核:pass
Coding of Images of Materials by Macaque Inferior Temporal Cortical Neurons
Köteles · European Journal of Neuroscience · 2008 · Zotero itemID=2197
这篇文章在清醒猕猴的下颞皮层(inferior temporal cortex, IT)单细胞水平上系统检验了一个长期被形状研究遮蔽的问题:神经元如何编码"物体由什么材料构成"的图像信息。它值得读在于三个层次的递进——先证明 IT 神经元对真实材料纹理有独立于形状的选择性,再用光照方向变化测量这种选择性的不变性,最后用随机相位控制图像把"纹理选择性"从低层功率谱效应中解放出来。
研究背景
我们日常识别的不只是"东西"(things),还有"材料"(stuff)——Adelson 如此区分。材料信息既帮助物体识别(亮闪闪的金属不太可能是香蕉),也直接指示物体属性(果实的成熟度、叶子的可食性)。单细胞记录与病灶研究表明 IT 皮层支持物体识别与分类;IT 神经元对形状高度选择,也有研究显示部分 IT 单元对波长敏感——波长相关的反射率正是一种材料属性。单色图像同样携带材料信息(三维纹理、光泽),仅凭灰度信息就能区分金属面和面包。多种人工纹理在包括 IT 在内的视觉区已显示出选择性。但人工纹理与真实材料有一个本质差别:真实材料有三维微结构,图像性质(平均亮度、对比度、明暗模式)强烈依赖于光照方向(Dana 等 1999)。此前尚无研究用真实材料的图像考察 IT 神经元对材料的选择性、以及这种选择性能否在光照方向变化下保持——这正是本研究要填的缺口。另一个平行问题是加工方式:有观点认为形状与材料属性由两个独立系统处理(Livingstone & Hubel 等);直观上也应当有某种程度的独立处理,因为不同形状的物体(不同视角下的面包)可以是同一种材料,而且人可以分别注意形状或材料。于是问题的具体形式是:IT 神经元对形状与材料纹理的编码是彼此独立的两群细胞,还是同一细胞上可分离的两套调谐?
研究思路
作者的设计是两条正交的刺激轴加上一个低层控制。第一,形状 × 纹理:12 种真实材料的图像(毛圈布、砂纸、石膏、铝箔、生菜叶、瓦片、盐晶、亚麻、混凝土、白面包等)与 5 种轮廓形状全交叉成 60 个条件,从单细胞反应的方差分解出形状主效应、纹理主效应与交互,并用可分离性指数 S 判断两套调谐是否互不干扰。第二,光照方向:每种材料从三个仰角(22.5°、45°、67.5°,方位角 0°)成像,考察材料选择性对光照的不变性。第三,随机相位控制:对每张图像做傅里叶变换,保留功率谱、随机化相位谱后反变换,若神经元对原图与对照的反应不同,则说明选择性不依赖功率谱(含平均亮度)——因为对照组的功率谱与原图几乎相同。作为"外部参照",作者还让 36 名人类被试对 36 张图做自由相似性分类,用于对比"知觉层面的光照不变性"与"神经层面的光照不变性"。最后用支持向量机(Support Vector Machine, SVM)做群体解码,定量回答"这些神经元的群体反应能否跨光照方向分类材料"。
方法
两只幼年恒河猴,在前部 IT(区域 TE:前部上颞沟下岸与外侧凸面)做标准胞外单细胞记录;动物只需完成注视任务(不要求辨别或分类刺激):注视小点 0.12°,刺激呈现 200 ms,试次间隔约 1000 ms,保持注视才有间断的苹果汁奖励,仅分析注视保持完好的试次。刺激取自 CURET 真实材料图像库(正对视角),转为灰度并做 gamma 校正;每张材料图与 5 种形状(约 4.5°)交叉。正式测试有两个:shape_texture 测试在同一天内固定一个光照方向,交错呈现 12 纹理 × 5 形状共 60 个条件(每条件约 10 次);illumination_direction 测试选取该神经元在线看出的最佳形状,交错呈现 36 张原图(12 材料 × 3 方向)加 36 张随机相位对照图。数据分析以刺激后 50–250 ms 为响应窗、刺激前为基线窗;用双因素方差分析检验形状/纹理(或材料/光照方向)主效应与交互,以关联强度指数 χ² 度量选择性大小(兼顾均值与试次间变异),以可分离性指数 S(乘法模型预测调谐的方差解释率,置换检验定显著)判断两维调谐是否独立;SVM 解码沿用 Hung 等(2005)的思路,以 106 个神经元 50 ms bin 的拼接反应向量为输入、C-SVM 加径向基核,70% 试次训练、30% 测试,训练与测试可在相同或不同光照方向间进行,重复 100 次取平均,偶然水平 1/12≈8.3%。
主要结果
- 材料纹理是 IT 神经元的实质性编码维度。125 个响应神经元中,77% 有显著形状主效应,84% 有显著纹理主效应;但选择性强度上纹理(中位 χ²=0.08)大于形状(中位 χ²=0.04),交互很小(中位 χ²=0.02),且两维选择性之间呈显著负相关(r=−0.30,P<0.001)——形状选择强的细胞纹理选择弱、反之亦然(图 3、图 4)。多数反应无法用平均亮度解释(如某神经元偏好较暗的 d、e、l 纹理却对亮度相仿的 g 无反应)。
- 两维调谐可分离。对同时调谐于形状与纹理的神经元,S 指数中位数达 0.81(ANOVA 标准入选的 89 个,全部显著高于随机置换水平;表 2);图 5 显示这 12 个双调谐细胞的纹理偏好在各形状间几乎不变,形状偏好在各纹理间同样如此——即"最佳纹理不因形状而变,最佳形状不因纹理而变",类似 V1 神经元朝向调谐不随空间频率改变。剔除生菜叶后结论不变(S=0.71)。
- 光照方向强烈影响反应,不变性普遍偏弱。光照方向测试的 127 个响应神经元中,83% 有材料主效应,48% 有光照方向主效应,65% 有二者交互(图 6–8);同种材料换一档光照(差 22.5°)反应平均变化 1.5 倍、换两档(差 45°)变化 1.7 倍(响应性指数中位数 0.19 与 0.25)。材料 × 光照的调谐可分离性中位数仅 0.59,只有约一半细胞达显著(表 3);光照偏好甚至会在材料排名两端反转(图 9A)。12 种材料中砂纸的光照不变性最高(群体神经距离均值 0.27,表 4)。
- 群体层面能跨光照方向解码材料,但远不如同光照条件。SVM 用一个方向训练、另一方向测试时,相邻方向间正确率约 40–50%,相差最大的两方向(22.5° vs 67.5°)降至约 23–31%,而偶然水平仅 8.3%;同方向训练测试则达 65–97%(表 5、图 10)。大部分解码信息在刺激后 200 ms 内已经可用(延长窗口仅提升约 5%)。生菜叶在全部六组训练—测试组合中几乎被完美分类,砂纸与混凝土次之(图 11)。剔除生菜叶后跨方向性能降至 17–54%,仍高于偶然。
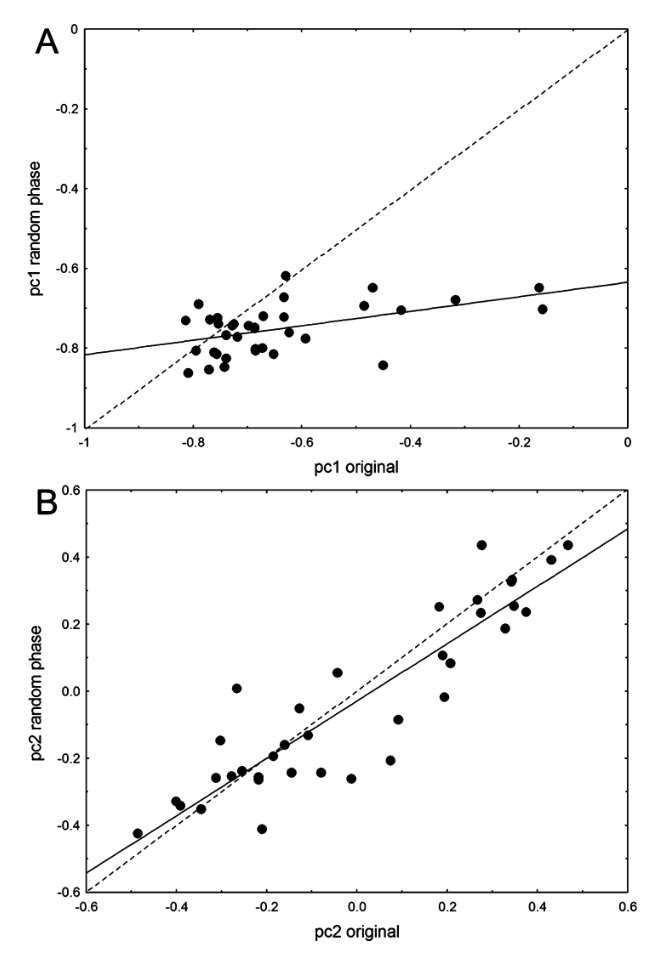
- 纹理选择性需要相位信息。112 个纹理选择神经元中 82% 对相位随机化有显著主效应或交互(中位 P 低至 0.00003);PCA 显示 PC1(解释 45% 方差)上原图与随机相位图显著分离(坐标相关仅 r=0.48,Wilcoxon P<0.000025),而 PC2(9% 方差)上两者几乎重合(r=0.90)且与平均亮度(r=0.68)和均方根对比度(r=−0.67)相关(图 12–14)。由于原图与对照的功率谱差异小于任意两张原图间的差异,PC1 的分离不能归因于功率谱的微小残余差别——亮度/功率谱因素合计解释不到 10% 的方差,材料纹理选择性主要依赖相位结构所载的高阶图像特征。
图注解读
图 1 · 刺激材料总览
原文图注:Fig. 1. Stimuli. (A) Images of the 12 materials illuminated from an elevation of 45°: (a) terrycloth, (b) sandpaper, (c) plaster, (d) aluminium foil, (e) lettuce leaf, (f) plaster (zoomed), (g) roof shingle, (h) salt crystals, (i) linen, (j) concrete, (k) white bread and (l) soleirolia plant. (B) Images of one material (terrycloth) combined with each of the five shapes employed.
A 面板给出 45° 仰角下的 12 种材料样例(a–l 为后文所有分析的字母标签),B 面板展示同一材料(毛圈布)嵌入 5 种轮廓形状的效果。它定义了全文的刺激命名体系,支撑方法与结果中"12 纹理 × 5 形状"的设计描述。
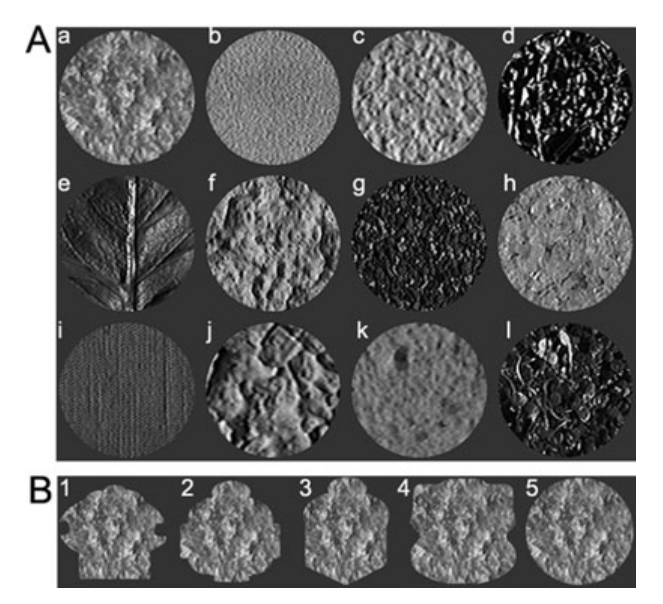
图 2 · 光照方向与相位随机化的操纵
原文图注:Fig. 2. Stimuli: manipulation of illumination direction and phase randomization. (A) Two materials shown for each of the three illumination directions (columns). Illumination direction condition 1, 2 and 3 refers to an elevation of 22.5°, 45.0° and 67.5°, respectively (azimuth: 0°). (B) Original and random phase version of the lettuce leaf image. (C) Original and random phase version of the sandpaper image. Note the more salient effect of the phase randomization for the lettuce leaf (B) compared with the sandpaper image (C).
A 面板并排呈现两个材料在三个仰角下的外观差异,B、C 面板对比生菜叶与砂纸的原图及其随机相位版本——生菜叶的相位随机化效果远比砂纸醒目。这张图直观说明两点:光照方向确实改变了材料图像的外观;相位控制操作的视觉后果依材料而异,为结果第 5 条的相位分析提供了感性基础。
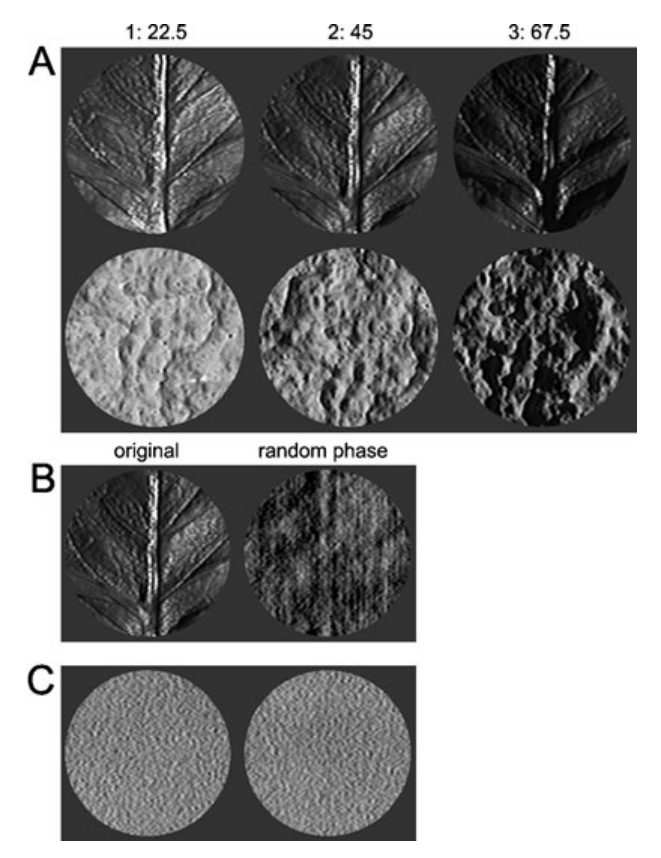
图 3 · 单细胞示例:纹理调谐与形状调谐的三种类型
原文图注:Fig. 3. Selectivity of IT neurons to 'material textures' and shape: single neuron examples. Peristimulus time histograms of the responses of single IT neurons to the 60 combinations of five shapes and 12 textures (shape_texture test). The stimuli in a row or column depict the same shape or texture, respectively. The numbers (shapes; rows) and letters (textures; columns) refer to the shapes and textures of Fig. 1A, respectively. Vertical lines in each histogram indicate stimulus on- and offset. (A) Neuron tuned to material texture but less so to shape. (B) Neuron tuned to shape but less so to material texture. (C) Neuron tuned to both texture and shape properties.
三个神经元的围刺激时间直方图(peristimulus time histogram, PSTH)阵列:行是形状、列是纹理。读法是看"按行扫描变化大"还是"按列扫描变化大"——A 细胞列间差异悬殊(纹理主导),B 细胞行间差异悬殊(形状主导),C 细胞两者都强。这张图给结果第 1 条提供了最直接的细胞个案。
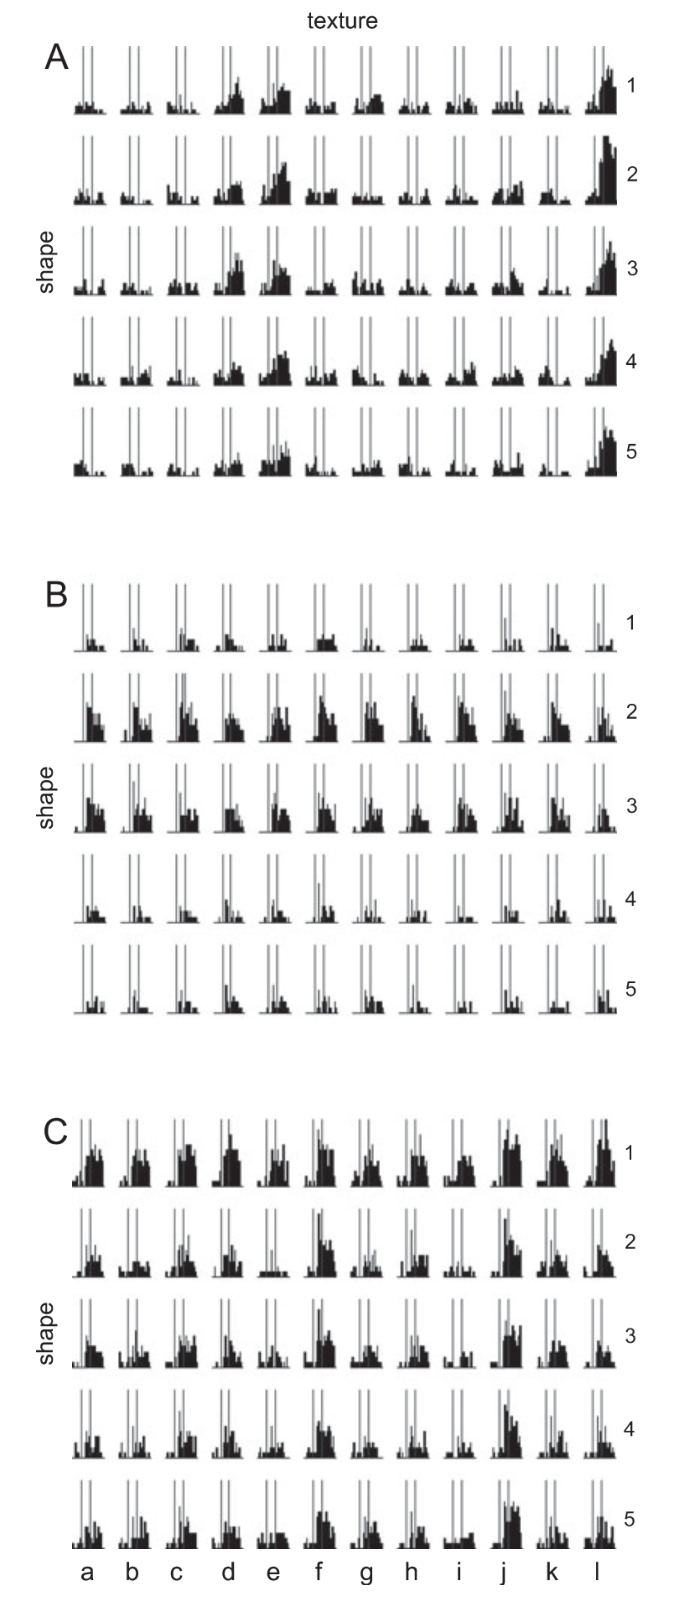
图 4 · 纹理与形状选择性的对比
原文图注:Fig. 4. The degree of texture and shape selectivity compared for the responsive neurons in the shape_texture test (n = 125). (A) The anova-based χ2 for texture plotted against that for shape. B. The texture selectivity indices (computed following Komatsu & Ideura, 1993) plotted against the shape selectivity indices. The values of the two animals (M1 and M2) are plotted using different symbols.
A 面板横轴为形状 χ²、纵轴为纹理 χ²,散点明显沿坐标轴聚集成"L"形而非对角线:改为“许多神经元在一个维度上的效应量较大、另一维度较低;但显著形状和纹理主效应在群体中都很常见”。,且两指数负相关(r=−0.30)。B 面板改用 Komatsu & Ideura 的 best/worst 选择性指数,两者仅弱正相关(r=0.23)。两张散点图合起来支撑结果第 1 条的"独立编码"结论。
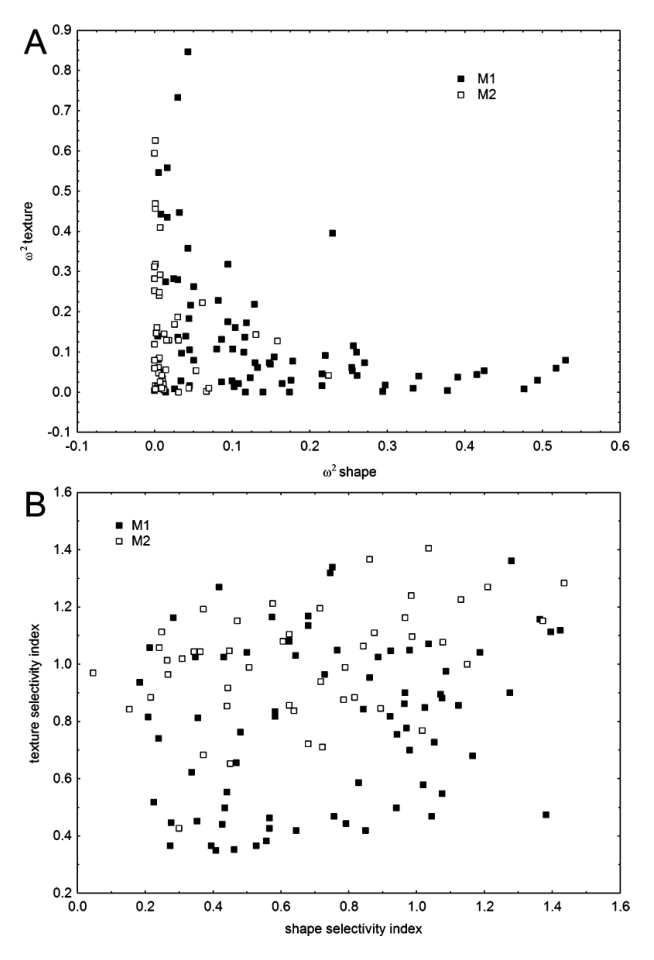
图 5 · 双调谐细胞调谐可分离性的可视化
原文图注:Fig. 5. Mean responses as a function of texture and shape rank for the neurons (n = 12) that show a selectivity index, χ2, larger than 0.10 for both shape and texture, or an interaction χ2 larger than 0.10. The shape rank is indicated by different symbols, with rank 1 corresponding to the shape with the largest mean response. Error bars indicate 95% confidence intervals.
对 12 个双调谐细胞按净反应做排名平均:横轴为纹理排名,不同符号为形状排名,纵轴为平均反应。若两维调谐纠缠,形状曲线会随纹理排名散开;实际图中不同形状的曲线几乎平行——纹理偏好在形状间保持,形状偏好在纹理间保持。这张图是结果第 2 条"可分离性 S=0.81"的图形化呈现。
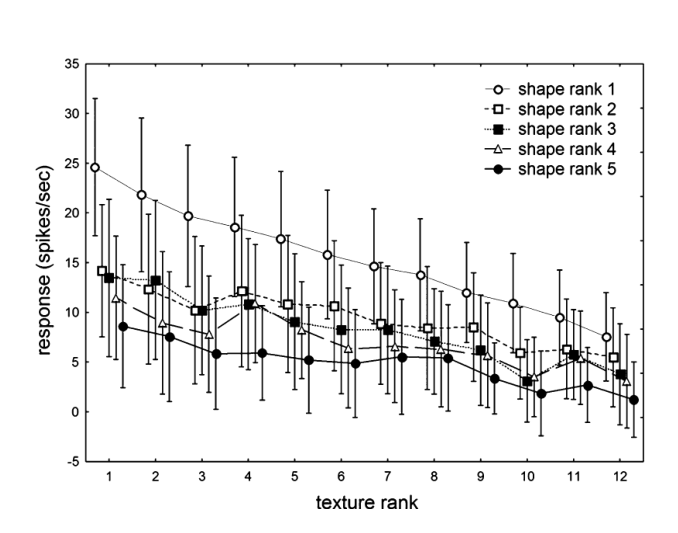
图 6 · 光照方向对单个 IT 神经元的影响
原文图注:Fig. 6. Effect of illumination direction on the responses of a single IT neuron to images of materials. Peristimulus time histograms of the responses of a single IT neuron to the 36 combinations of 12 materials and three illumination directions. The stimuli of a row and column depict the same illumination direction and material, respectively. The letters (materials; columns) refer to the materials of Fig. 1A, while the numbers indicate the illumination directions in degrees of elevation. Vertical lines in each histogram indicate stimulus on- and offset. This example neuron showed a strong effect of material and illumination direction.
示例神经元在 67.5° 仰角下对材料反应强烈而选择,22.5° 下几乎无反应,45° 下只对部分材料反应。行间(光照)差异一目了然,说明光照方向本身就能开关一个细胞对整组材料的反应。它支撑结果第 3 条中"光照方向强烈影响反应"的论断。
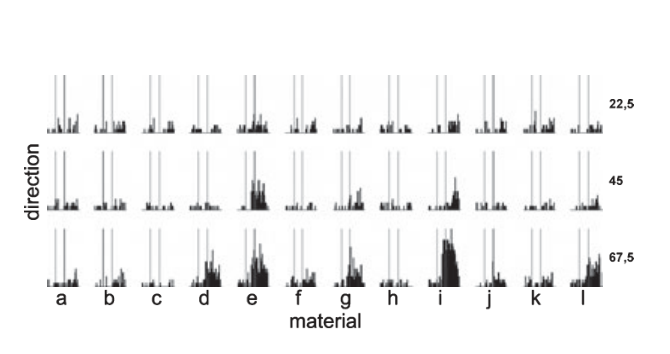
图 7 · 光照与相位的联合影响:示例 1
原文图注:Fig. 7. Effect of illumination direction and phase randomization on the responses of a single IT neuron: single neuron example 1. Peristimulus time histograms of the responses of a single IT neuron to the 36 combinations of 12 materials and three illumination directions for the original (top) and random phase images (bottom). The stimuli of a row and column depict the same illumination direction and material, respectively. The letters (materials; columns) refer to the materials of Fig. 1A, while the numbers indicate the illumination directions in degrees. Vertical lines in each histogram indicate stimulus on- and offset. This example neuron showed effects of material, illumination direction and phase randomization.
上排为原图、下排为随机相位对照:同一材料、同一光照方向下,上下两排的反应可以差别悬殊。改为“该结果提示相位信息对反应有重要贡献;结合残余功率谱差异检查及群体分析,选择性不能仅由功率谱解释”。它为结果第 5 条提供细胞个案。
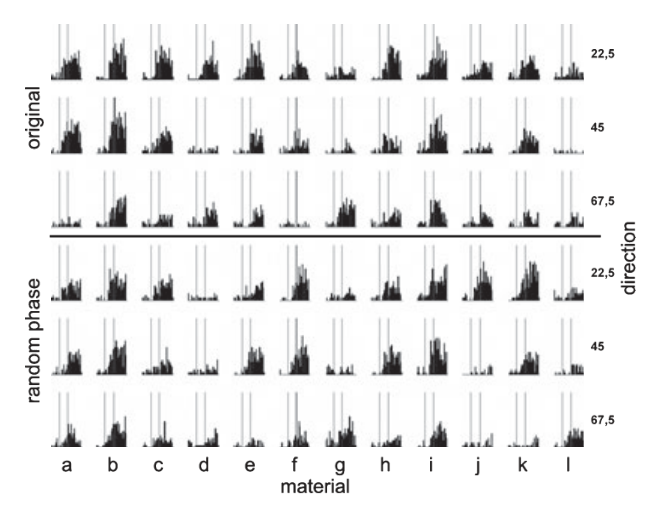
图 8 · 光照与相位的联合影响:示例 2
原文图注:Fig. 8. Effect of illumination direction and phase randomization on the responses of a single IT neuron: single neuron example 2. Same conventions as in Fig. 7. This example neuron responded selectively to the lettuce leaf for the three illumination directions and showed a strong effect of phase randomization.
这个细胞对生菜叶在三个光照方向下都选择性强反应——是全文少见的接近"光照不变"的个案;但同条件下它对混凝土(j)的反应只在 67.5° 出现,说明不变性并不彻底。相位随机化也强烈改变其反应。支撑结果第 3、5 条。
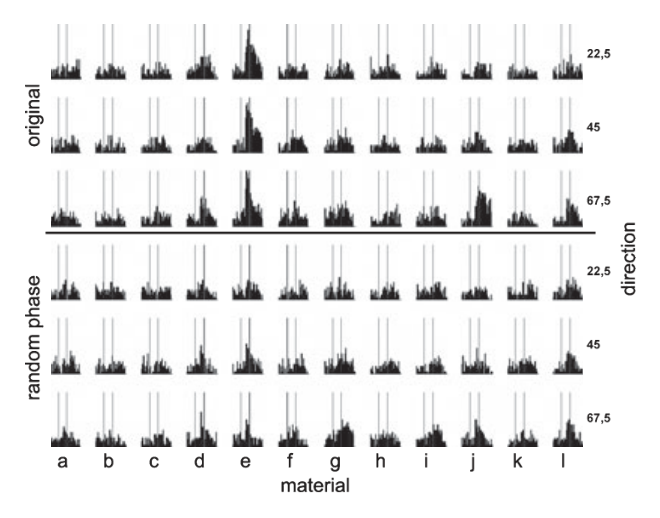
图 9 · 群体平均反应:材料与光照方向
原文图注:Fig. 9. Mean responses as a function of material and illumination direction. (A) Mean responses as a function of material and illumination direction for the 68 neurons that demonstrated a χ2 of at least 0.10 for the main effect of materials or the interaction of the two factors. The illumination direction rank is indicated by different symbols, with rank 1 corresponding to the illumination direction with the largest mean response. (B) Mean net response strength for all neurons (n = 127) responsive to at least one of the 12 materials for each of the three directions of illuminations. The materials are labelled as in Fig. 1 and the illumination directions are indicated as given in the legend. Error bars indicate 95% confidence intervals.
A 面板把每个细胞的材料偏好与光照偏好分别排名后平均:光照偏好曲线在不同材料间大体平行,但在材料排名的两端(最佳与最差材料)发生反转,提示调谐可分离但分离不完全。B 面板为 127 个细胞对每种材料三个方向的净反应均值:生菜叶与混凝土群体反应偏大,但 Bonferroni 校正后材料间两两差异均不显著。支撑结果第 3 条。
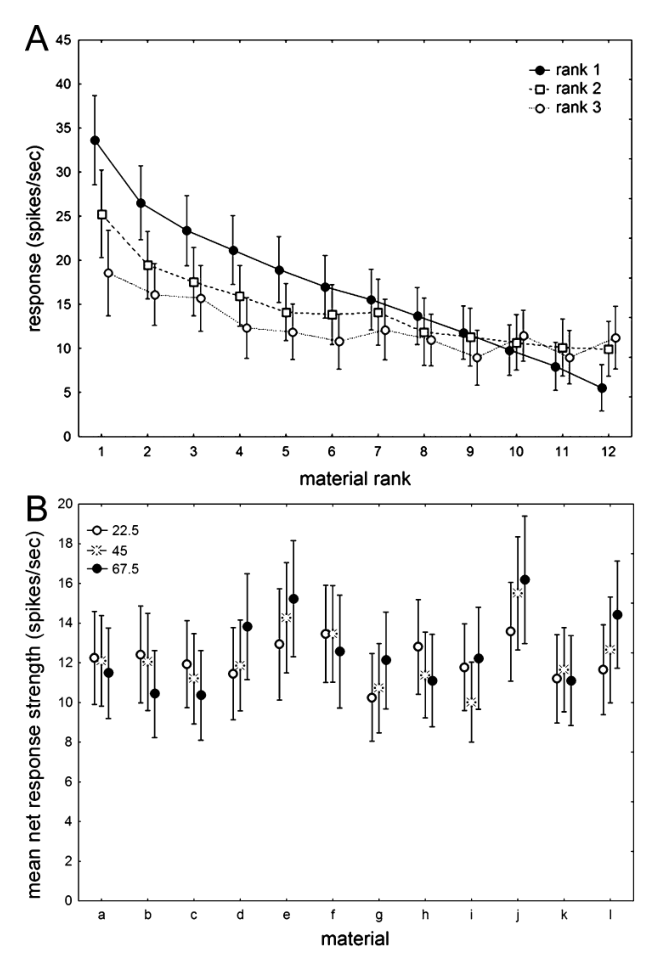
图 10 · SVM 跨光照方向分类材料的性能
原文图注:Fig. 10. Classification performance of materials across illumination direction with Support Vector Machines that use IT responses as input. Per cent correct classification is plotted as a function of the end of the analysis window. The start of the analysis windows was always 50 ms. Full lines: SVM trained and tested with the same illumination direction. Stippled lines: SVM tested with an illumination direction other than the trained one. For A, B and C the trained illumination directions were 1, 2 and 3, respectively. In the case of the stippled lines, the tested illumination directions were 2, 3 and 1, respectively. Chance performance is indicated by the horizontal dashed-dotted line. Error bars indicate standard deviations on the average per cent correct classifications across 100 permutat…
横轴为分析窗终点(50 ms 起,200–400 ms),纵轴为分类正确率;实线是同方向训练+测试,虚线是跨方向测试,虚线由高到低依次为相邻方向与最远方向,水平虚点线为偶然水平 8.3%。关键读法:虚线远高于偶然水平但显著低于实线,且距离越远越低;窗口延长只带来约 5% 提升。支撑结果第 4 条。
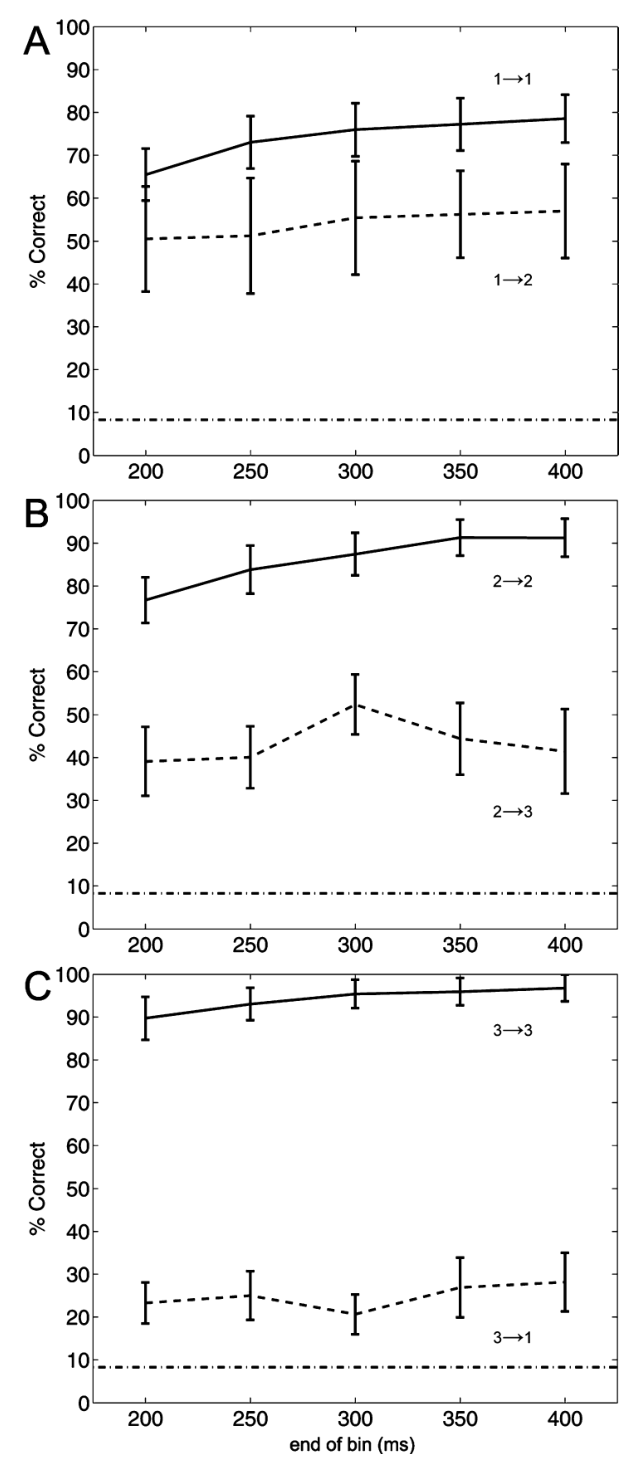
图 11 · SVM 分类的混淆矩阵
原文图注:Fig. 11. Classification performance of materials across illumination direction with Support Vector Machines that use IT responses as input: confusion matrices. The per cent classification of a material (input; vertical axis) identified as the material labelled on the horizontal axis. The values sum to 1 in each row. Proportions are indicated as grey levels. The trained and tested illumination directions are indicated by numbers in each panel.
六组训练—测试方向组合各一个 12×12 矩阵:行输入、列输出,对角线为正确分类,灰阶表示比例。读法是看对角线的"塌陷分布"——跨方向时对角线变淡、错误分散,但生菜叶一行在对角线上几乎保持 1;砂纸与混凝土在半数组合同样表现优秀。支撑结果第 4 条的补充细节。
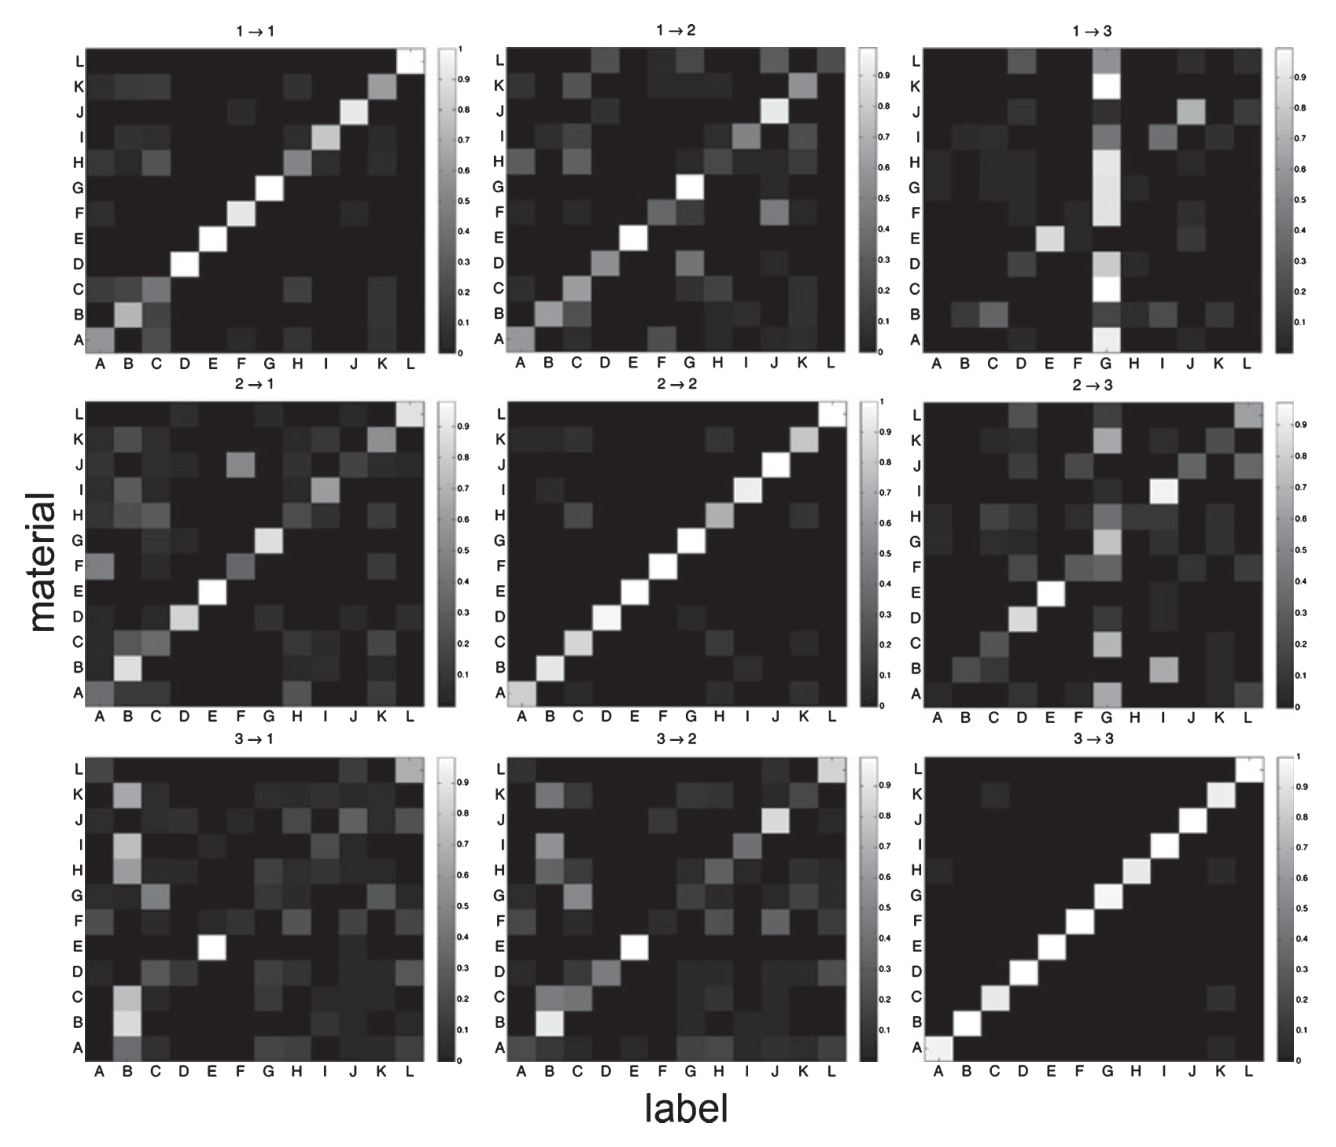
图 12 · 群体反应的多变量结构
原文图注:Fig. 12. Population analysis of responses of IT neurons to images of 12 materials illuminated from each of three different directions. (A) Tree diagram of the results of a cluster analysis based on the correlation of the normalized responses to the 36 original images. The three different illumination directions are indicated by different colors (red, blue and black corresponding to 22.5°, 45.0° and 67.5°, respectively) and numbers (as in Fig. 2A). The letters indicate the 12 materials using the convention of Fig. 1A ('e' is the lettuce leaf). Horizontal stippled lines and the numbers indicate the three different clusters. (B) Scree plot of the principal component analysis of the same data as employed in a showing the eigenvalues as a function of the PC number. The per cent explained variances for the first four PCs are indicated at the corresponding data points. (C and D) Results of the PCA of the same data as that employed in A. Same color and letter conventions as in A. (C) Plot of factor coordinates of the 36 images on PC1 and PC2. (D) Plot of factor coordinates of the 36 images on PC1 and PC3. Per cent explained variance for each PC is listed on the abscissa and ordinate legends. Cluster 1, 2 and 3 of the Cluster Analysis (A) can also be seen in the results of the PCA analysis: cluster 2 corresponds to the three images of the lettuce leaf, which are positioned in the upper right corner of plot D, cluster 3 is differentiated from cluster 1 along PC2, with the images of cluster 1 positioned in the upper left corner of plot C.
基于归一化反应相关矩阵的聚类树与 PCA:36 张原图聚成三簇——16 张七种材料的低仰角图像、三张生菜叶图像、其余图像;PC1 解释 45% 方差,主要区分生菜叶与其余,PC2(9%)区分第一簇与第三簇。这张图界定了后文 PC1/PC2 语义解读的基础,支撑结果第 5 条。
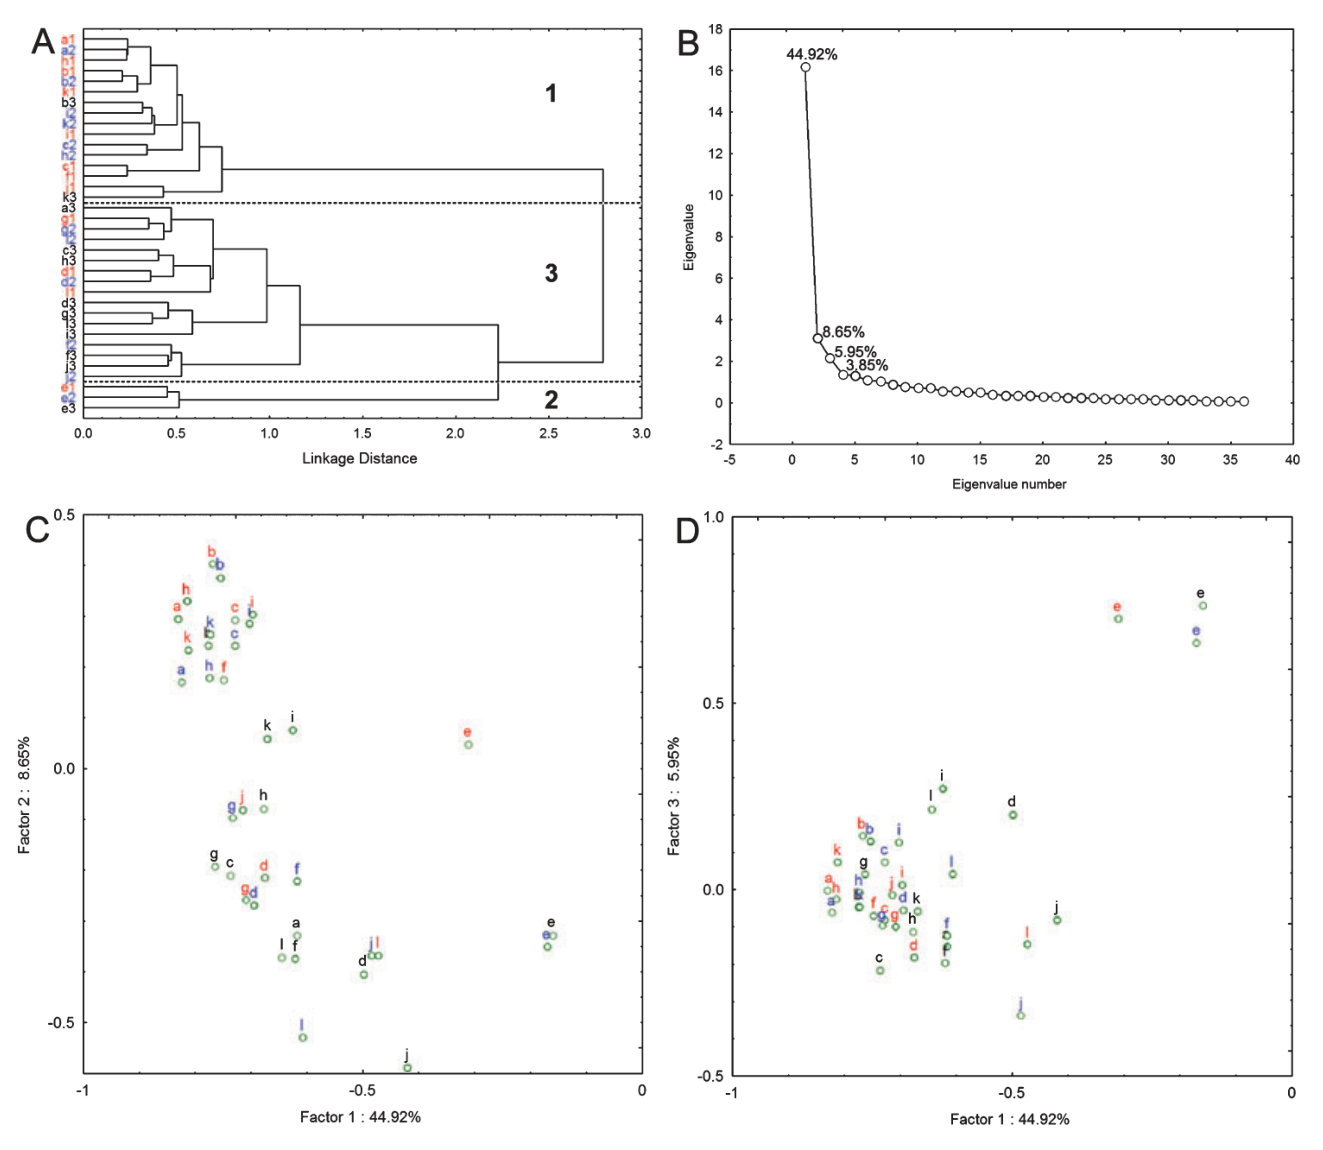
图 13 · 原图与随机相位图响应的 PCA 对比
原文图注:Fig. 13. Principal components analysis of the responses to the original and random phase images. (A) Principal components analysis of the normalized responses to the 36 original (closed symbols) and 36 random phase (open symbols) images. (B) Principal components analysis of the normalized responses to the 33 original (closed symbols) and the corresponding 33 random phase (open symbols) images, thus excluding responses to the three lettuce leaf images. The letters and numbers indicate the material (as in Fig. 1A) and the illumination directions (as in Fig. 2A), respectively. The image coordinates for the first two principal components are shown.
把 72 张图(原图实心、相位图空心)投到 PC1–PC2 平面:沿 PC1 方向原图与相位图明显分居两处(生菜叶与第三簇中如此),而 PC2 上两实心—空心点几乎成对重合。B 面板剔除生菜叶后 PC1 分离依旧存在(解释 53% 方差),排除了"生菜叶特殊性"的解释。这是结果第 5 条的核心证据图。
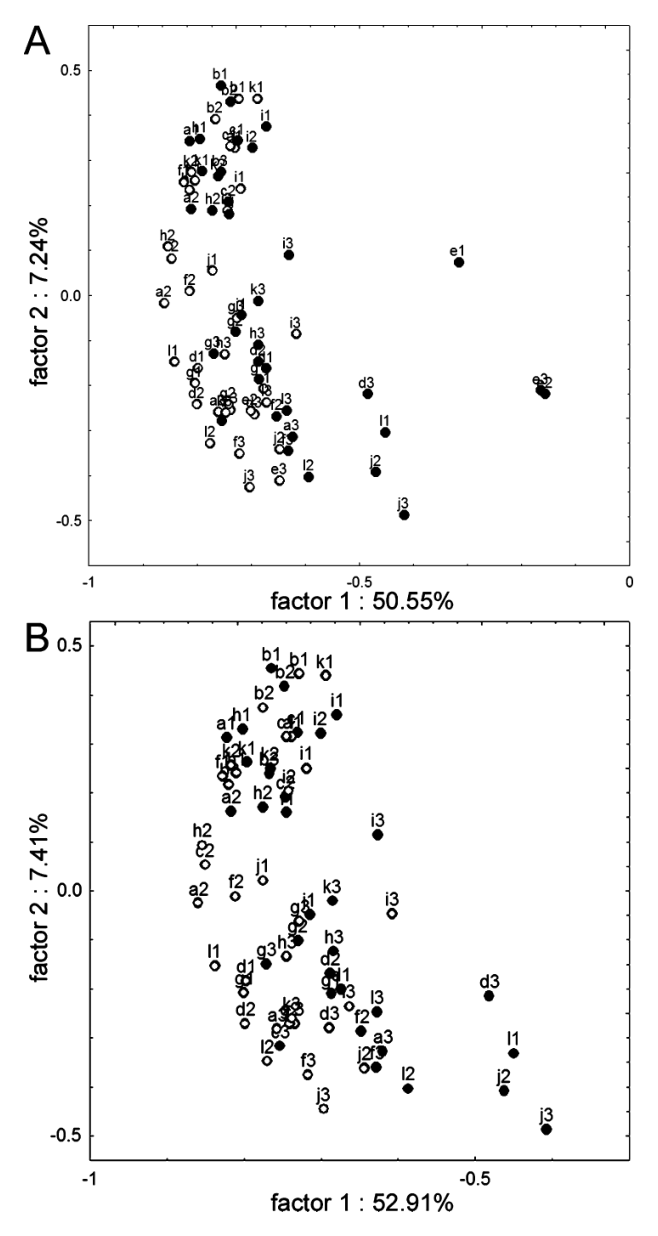
图 14 · 原图与相位图主成分坐标的相关
原文图注:Fig. 14. Correlation of principal component coordinates of the 36 original images and their corresponding random phase images. (A) PC1 coordinates. (B) PC2 coordinates. Stippled and solid lines indicate the diagonal and linear regression fit, respectively.
横轴为原图坐标、纵轴为对应相位图坐标,虚线为对角线(完全一致)、实线为回归拟合。A 图 PC1 坐标只有弱相关(r=0.48)且系统偏离对角线,B 图 PC2 坐标紧密贴合对角线(r=0.90)。一图概括"PC1 相位相关、PC2 功率谱相关"的双分量结论。
讨论
作者的结论分四步收束。第一,IT 神经元确实选择性响应真实材料图像,因此可以参与材料的编码,但需要先分清"识别特定材料"(需要熟悉该材料的图像)与"材料归类"(需要对一类材料的广泛图像都选择性)——后者靠训练获得对不变特征的敏感性,而本研究动物未受辨别训练。第二,光照不变性弱于人类知觉:36 名人类被试自发把 12 种材料中的 8 种按材料归类、无视光照方向,而 IT 群体反应的同材料聚类远没有这么干净;光照引起的反应变化(1.5–1.7 倍)小于 Kovacs 等(2003)去掉全部明暗与颜色信息时的变化,这可以理解,因为换光照保留了形状内部更多的特征。作者承认,若先训练动物做光照无关的材料辨认,不变性可能会更强;场景中缺少标示光照方向的语境线索也可能是原因之一——但心理物理学表明粗糙度知觉的不变性恰恰不受益于语境(Ho 等 2006),使这个问题保持开放。第三,选择性的机制不能化约为频域调谐:亮度与功率谱因素只解释不到 10% 的方差,解释约一半方差的 PC1 依赖相位信息——这与"V4 神经元的形状选择性可由谱感受野解释"的模型(David 等 2006)形成对照,作者推测 V1 端点抑制神经元的早期非线性加工可能是功率谱之外信息的来源。第四,与既往形状研究的对接:Komatsu & Ideura(1993)发现形状与图形模式选择性高正相关,本研究却得到弱正相关乃至负相关,作者归因于其人工图形的模式特征与形状维度更相似;而本研究的可分离调谐说明形状与材料被当作两个独立维度对待,这与波长选择性的既有发现(形状选择性不因波长改变)一致。作者还讨论了形状—材料"松散绑定"对归类(椅子、木头)而非个体识别(某把木椅)的功能意义,并援引 Cant & Goodale(2007)的人类 fMRI 结果——注意纹理激活更内侧/腹侧区域、注意形状激活更外侧区域,但外侧枕区(LO,猕猴 IT 的人类同源区)在两个注意条件下都被激活——与本研究"IT 同时编码两者"互相印证;至于更腹侧/内侧的猕猴区是否表现出更强的光照不变材料选择性,只能留待后续研究。局限方面作者明言:材料样本虽大但属任意抽样、每种材料每方向只有一张图像、生菜叶含强形状特征(叶脉)——不过所有主要结论在剔除生菜叶的分析中依然成立。
一句话总结
按我的理解,这篇工作的分量在于它把"材料知觉"从形状研究的注脚提升为 IT 皮层的正式研究对象,并诚实地报告了一个反直觉的落差:单细胞对光照方向非常敏感、不变性普遍不完整,但群体解码仍能跨光照读出材料身份——改为“伪群体反应包含可被SVM跨光照读出的材料信息;其在同步真实群体中的实现及噪声相关影响仍未检验”。;至于生菜叶为什么好分得离谱,作者的"叶脉是形状特征"解释我觉得是全文最可爱的自我检讨。
审校与证据追溯 (Verification & Evidence)
图表审计结果
- Fig1: 提取质量
good,对齐度full,识别面板[A, B] - Fig10: 提取质量
good,对齐度full,识别面板[A, B, C] - Fig11: 提取质量
good,对齐度full,识别面板[] - Fig12: 提取质量
good,对齐度full,识别面板[A, B] - Fig13: 提取质量
good,对齐度full,识别面板[A, B] - Fig14: 提取质量
good,对齐度full,识别面板[A, B] - Fig2: 提取质量
good,对齐度full,识别面板[A, B, C] - Fig3: 提取质量
good,对齐度full,识别面板[A, B, C] - Fig4: 提取质量
good,对齐度full,识别面板[A, B] - Fig5: 提取质量
good,对齐度full,识别面板[] - Fig6: 提取质量
good,对齐度full,识别面板[] - Fig7: 提取质量
good,对齐度full,识别面板[] - Fig8: 提取质量
good,对齐度full,识别面板[] - Fig9: 提取质量
good,对齐度full,识别面板[A, B]
关键事实与局限性声明
- 审校纠偏: {'current_text': '证明IT神经元对真实材料纹理有独立于形状的选择性/支撑“独立编码”结论', 'classification': 'OVERCLAIM', 'problem': '数据支持在所测刺激集合中形状与纹理调谐大体可分离,但不能证明独立神经通路、独立计算机制或完全独立的编码。', 'recommended_fix': '使用“调谐大体可分离”“可被视为不同刺激维度”,避免无条件的“独立编码”。'} -> 评注:
- 审校纠偏: {'current_text': '若神经元对原图与对照的反应不同,则说明选择性不依赖功率谱', 'classification': 'OVERCLAIM', 'problem': '原文结论是选择性不能仅由功率谱差异解释,而不是完全不依赖功率谱;PC2及其与亮度、RMS对比度的相关恰好表明功率谱相关因素仍有贡献。', 'recommended_fix': '改为“说明相位信息具有额外贡献,功率谱不足以单独解释选择性”。'} -> 评注:
- 审校纠偏: {'current_text': '材料纹理选择性主要依赖相位结构所载的高阶图像特征', 'classification': 'INTERPRETATION', 'problem': '相位依赖及“不能化约为功率谱”有数据支持,但具体高阶特征尚未被定义;“主要依赖”比作者的证据边界更强。', 'recommended_fix': '改为“相位信息是重要决定因素,提示存在尚未定义的高阶图像特征贡献”。'} -> 评注:
- 补充要点: : (第 5 页)
- 补充要点: : (第 6 页)
- 补充要点: : (第 9 页)
- 补充要点: : (第 14 页)
- 补充要点: : (第 页)